Don't Ignore This Chart! October 29, 2010 at 02:47 PM
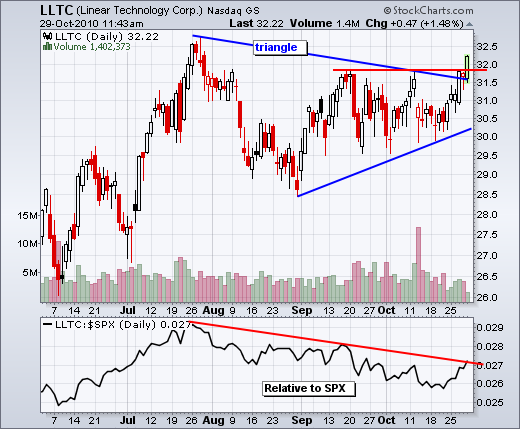
Linear Tech (LLTC) formed a large triangle over the last three months and broke resistance with a surge this week. Also notice that the stock broke above its September highs. Semis are showing upside leadership and this is positive for the tech sector... Read More
Don't Ignore This Chart! October 27, 2010 at 06:47 PM
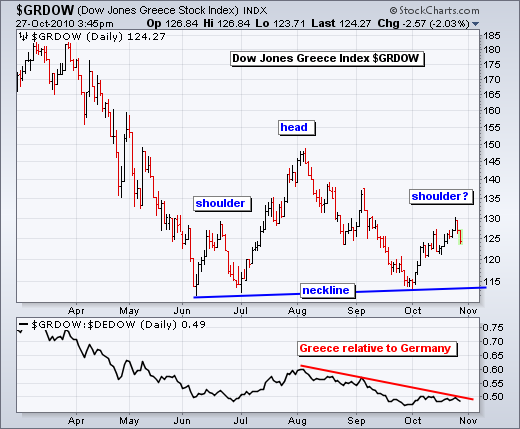
The DJ Greece Index ($GRDOW) shows a potential head-and-shoulders pattern evolving over the last five months. This version is a continuation pattern. A move below the October low would confirm the pattern and target lower prices... Read More
Don't Ignore This Chart! October 26, 2010 at 02:51 PM
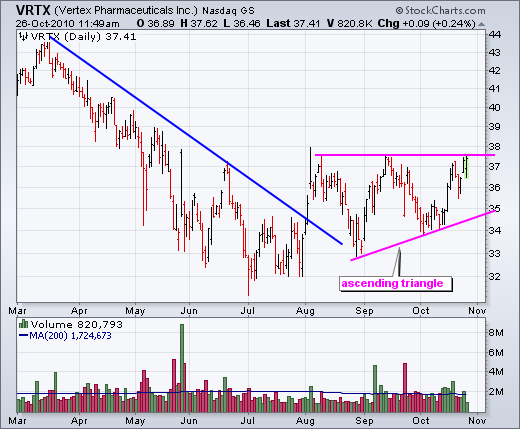
After a trendline breakout in August, Vertex Pharma (VRTX) traced out a potentially bullish ascending triangle. Notice the higher low in early October and the equal highs in August and September. A break above the September high on good volume would confirm this bullish pattern... Read More
Don't Ignore This Chart! October 25, 2010 at 01:57 PM
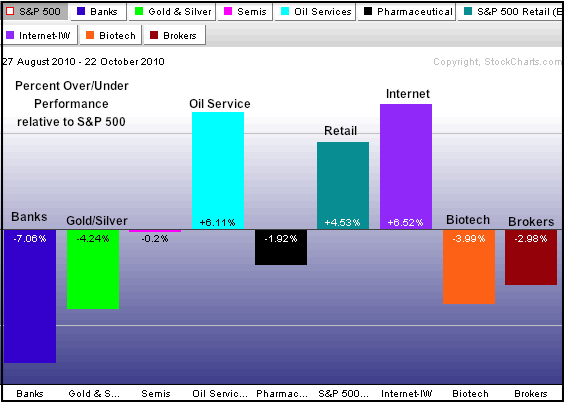
John Murphy's industry group perfchart shows oil services and internet stocks leading the market since August 27th. It's a rather motly pair. Banks are the biggest laggards. In a bit of a surprise, gold and silver stocks ($XAU) are also lagging the broader market... Read More
Don't Ignore This Chart! October 22, 2010 at 02:58 PM
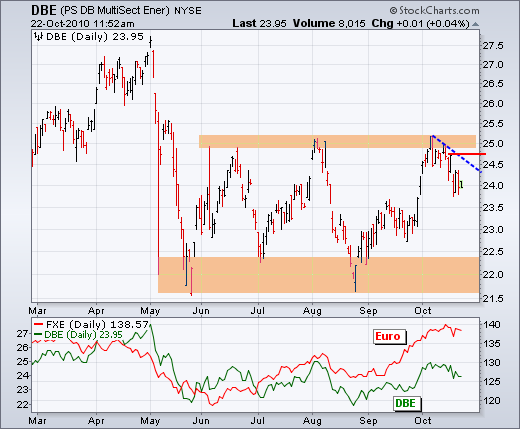
The Multisector Energy Fund (DBE) has been stuck in a trading range since late May. Range support is set near 25 and range resistance near 22. With the October pullback, the ETF has failed at resistance and showed weakness... Read More
Don't Ignore This Chart! October 21, 2010 at 05:21 PM
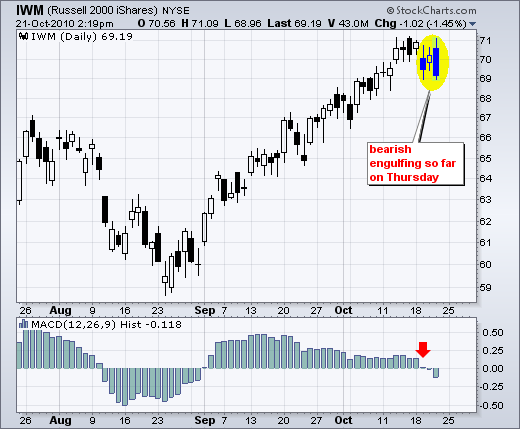
With a strong open Thursday morning and a sharp move lower in the afternoon, the Russell 2000 ETF has a bearish engulfing pattern working on the day. The bulls started in control, but the bears clearly took control in the afternoon... Read More
Don't Ignore This Chart! October 20, 2010 at 06:41 PM
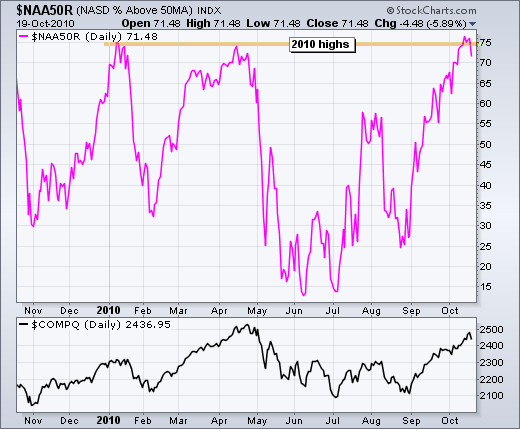
The Nasdaq %Above 50-day SMA ($NAA50R) is trading near the prior 2010 highs. This indicator surged to the mid 70s in January and again in April. Prior moves to this area signaled overbought conditions that led to a pullback... Read More
Don't Ignore This Chart! October 19, 2010 at 08:05 PM
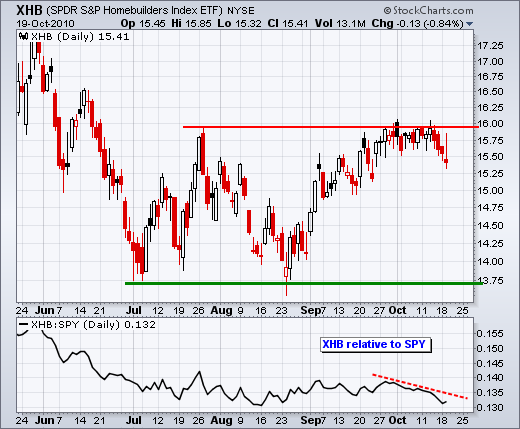
The Homebuilders SPDR (XHB) surged to resistance at the end of Septmeber, but failed to follow through with a breakout in October. After trading flat for two weeks, the ETF is starting to move lower and showing relative weakness. Again... Read More
Don't Ignore This Chart! October 18, 2010 at 06:58 PM
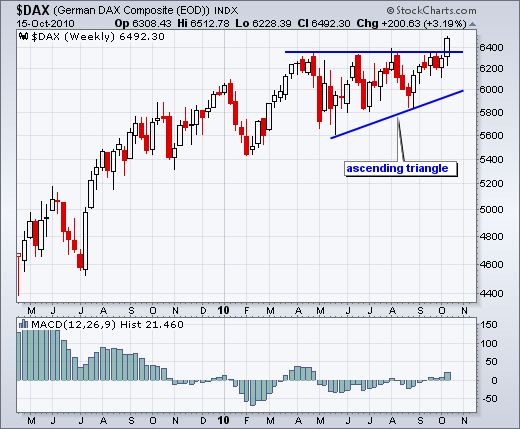
The German DAX Index ($DAX) continues to lead the world with an ascending triangle breakout. These are bullish continuation patterns. The height of the pattern (±700) is added to the resistance breakout for an upside target... Read More
Don't Ignore This Chart! October 15, 2010 at 02:54 PM
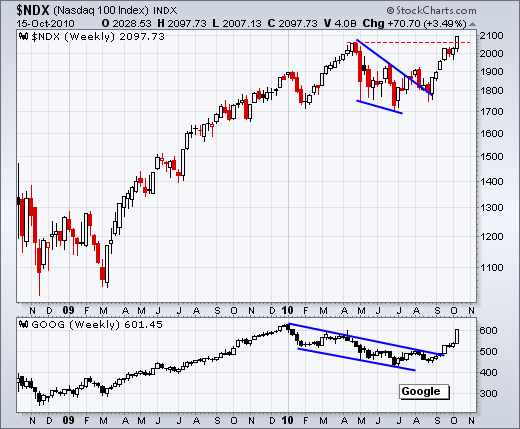
With a little help from Google (and Apple), the Nasdaq 100 surged above the April high this week to record a new 52-week high. Large techs are showing relative strength as one of the first groups to break this high... Read More
Don't Ignore This Chart! October 14, 2010 at 06:02 PM
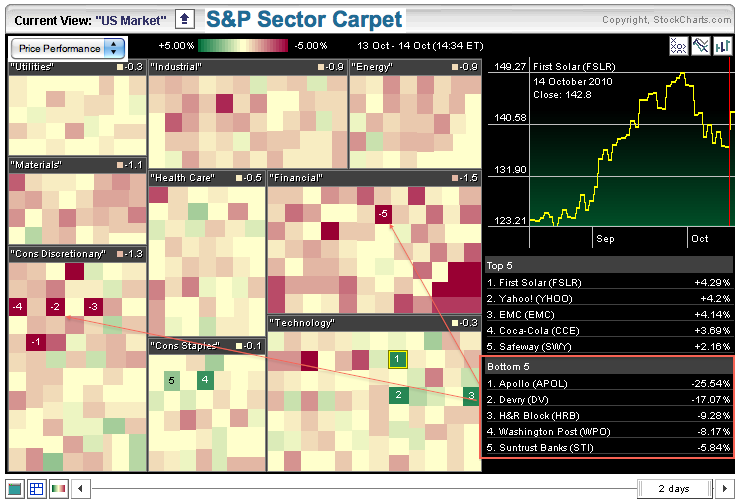
The sector market carpet shows lots of red in the consumer discretionary and finance sectors. Four of the five biggest losers come from the consumer discretionary sector. The finance sector also has quite a few dark red squares, indicating stocks with relative weakness... Read More
Don't Ignore This Chart! October 13, 2010 at 12:27 PM
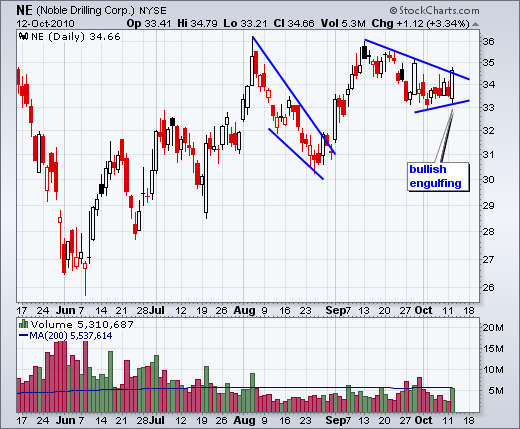
With a weak open and strong close in stock market, 70 securities appears on the bullish engulfing scan for the Nasdaq and NYSE. The chart below shows Noble Drilling (NE) surging in early September, correcting into early October and then forming a bullish engulfing on Tuesday... Read More
Don't Ignore This Chart! October 12, 2010 at 01:50 PM
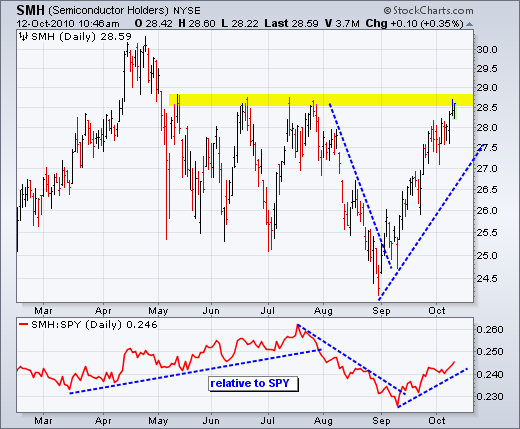
The Semiconductor HOLDRS (SMH) continues to show relative strength as it surges to its summer highs. Reaction highs in June-July mark a resistance zone around 28.7... Read More
Don't Ignore This Chart! October 11, 2010 at 11:05 AM
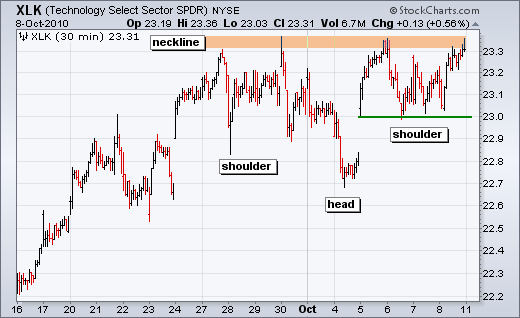
The Technology ETF (XLK) has been consolidating the last two weeks with a small inverse head-and-shoulders pattern. This pattern is best viewed using intraday charts. Neckline resistance resides around 23.3-23.5 and the ETF is testing this area for the fourth time since 27-Oct... Read More
Don't Ignore This Chart! October 08, 2010 at 02:05 PM
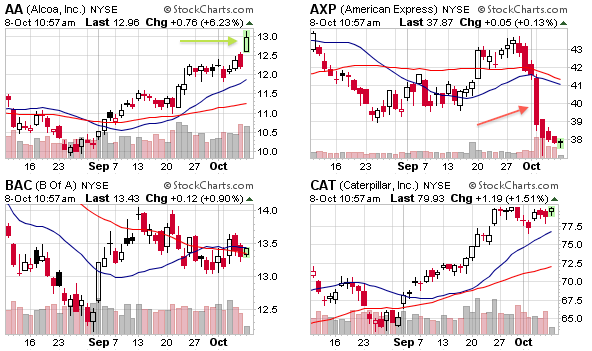
Alcoa is showing upside leadership with a surge and break above short-term resistance the last few days. Upside volume has also been impressive. The charts below come from the Dow CandleGlance page, which shows small candlestick charts for all 30 Dow components... Read More
Don't Ignore This Chart! October 07, 2010 at 08:45 PM
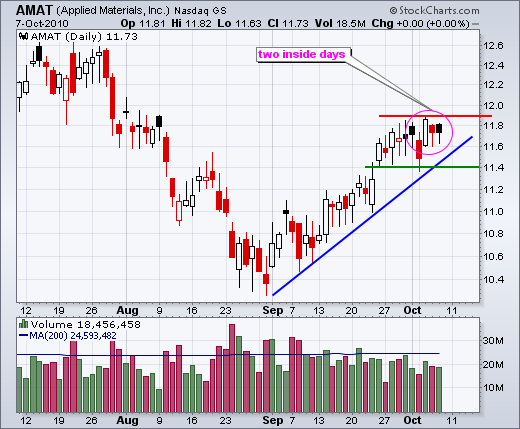
After a surge on Tuesday, Applied Materials (AMAT) stalled on Wednesday to firm an inside day and harami. This pattern extended on Thursday as the stock again traded within Tuesday's range. A consolidation within an 5-week uptrend is forming... Read More
Don't Ignore This Chart! October 06, 2010 at 01:45 PM
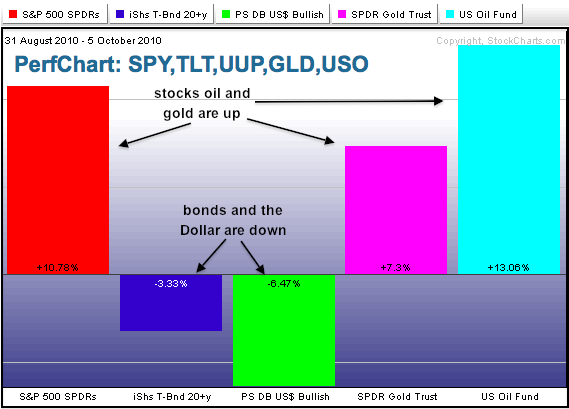
The risk-on trade remains alive and well in October. As the Perfchart below shows, stocks, oil and gold are strong, while bonds and the Dollar are weak. The relationships reflect a market that is embracing risk. Strength in the Dollar and bonds would start to suggest otherwise... Read More
Don't Ignore This Chart! October 05, 2010 at 04:42 PM
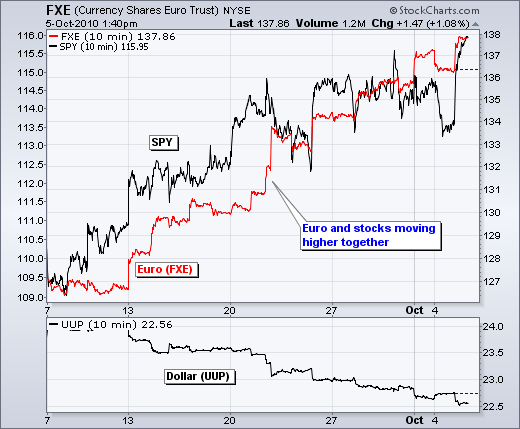
When it comes to stocks, it's all about the Dollar the last four weeks. The chart below shows the Euro Currency Trust (FXE) rising along side the S&P 500 ETF (SPY). The bottom window shows the Dollar Bullish ETF (UUP) falling... Read More
Don't Ignore This Chart! October 04, 2010 at 04:41 PM
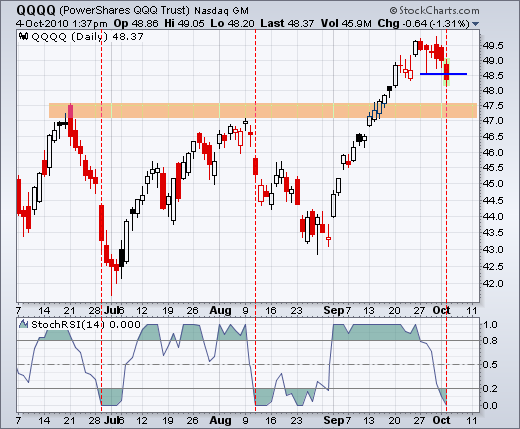
With a move below last week's lows, the Nasdaq 100 ETF (QQQQ) broke below consolidation support and StochRSI became oversold for the first time since late August. This oversold reading looks like a sign of weakness because it is occurring along side the support break... Read More
Don't Ignore This Chart! October 01, 2010 at 03:01 PM
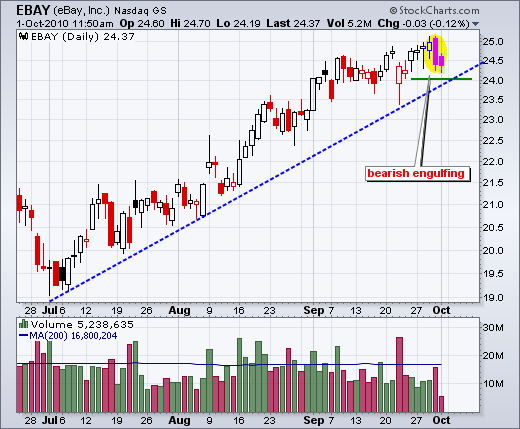
The bearish engulfing scan on the pre-defined scans page at StockCharts.com featured 105 Nasdaq stocks and 177 NYSE stocks. The chart below shows EBAY with a rather large bearish engulfing pattern on Thursday. Trendline support is set at 24... Read More
Don't Ignore This Chart! September 30, 2010 at 10:40 PM
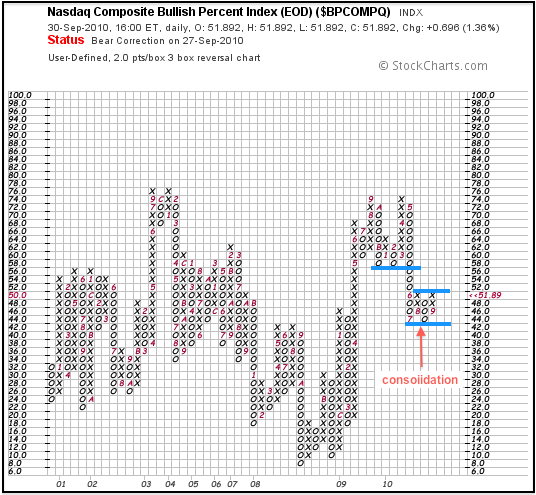
Despite the sharp September rally, the Nasdaq Bullish% Index ($BPCOMPQ) remains stuck in a consolidation and has yet to break its summer highs... Read More