Don't Ignore This Chart! November 30, 2010 at 05:50 PM
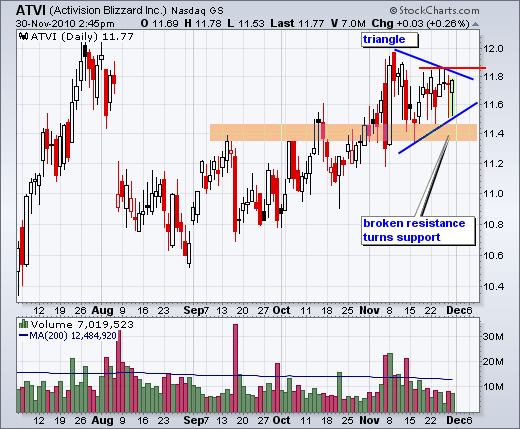
After a breakout in early November, Activision (ATVI) consolidated with a triangle over the last few weeks. The consolidation slowly narrowed with the stocks trading between 11.45 and 11.86 the last nine days. A break from this range will trigger the next signal... Read More
Don't Ignore This Chart! November 29, 2010 at 05:09 PM
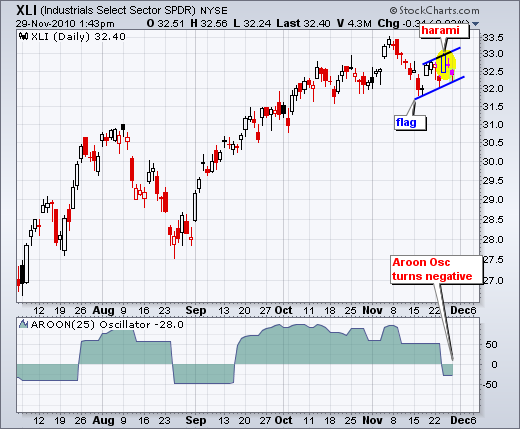
The Industrials SPDR (XLI) bounced over the last two weeks, but the rise looks like a bearish flag. Also notice that the ETF formed a harami on Wednesday-Friday last week and the Aroon Oscillator turned negative for the first time since mid September... Read More
Don't Ignore This Chart! November 26, 2010 at 09:21 AM
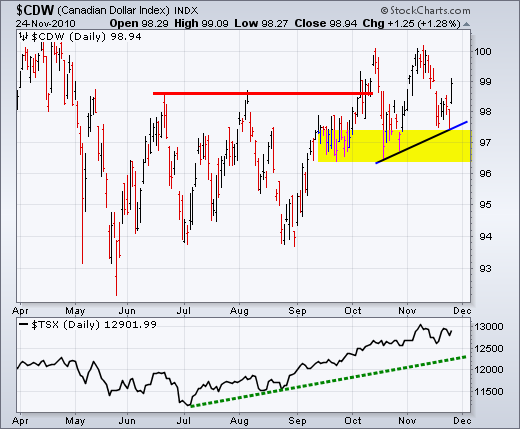
The Canadian Dollar Index ($CDW) is showing strength with a higher low in November and big surge this week. Also called the "Loonie", the Canadian Dollar exceeded its summer highs in October and then consolidated several weeks... Read More
Don't Ignore This Chart! November 24, 2010 at 08:32 AM
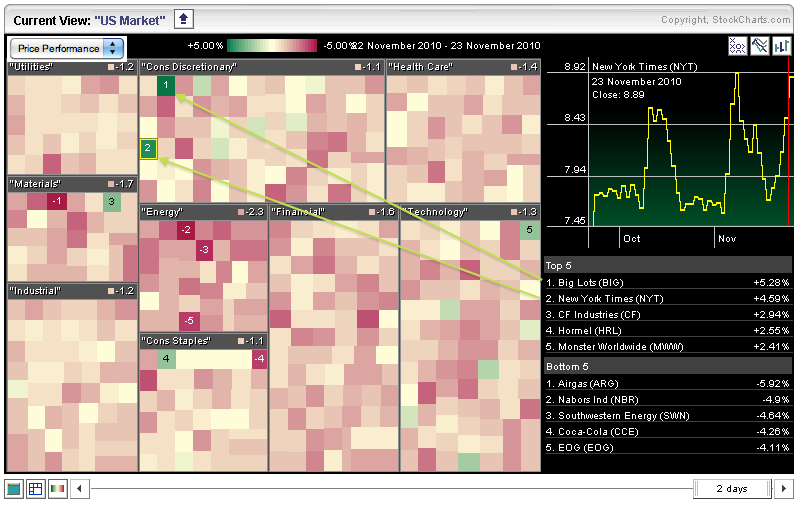
The market carpet shows a sea of red over the last two days, but there are a few green squares to be found. There are six in the consumer discretionary sector and five in the technology sector. Big Lots (BIG) is up over 5% and New York Times (NTY) is up over 4%... Read More
Don't Ignore This Chart! November 23, 2010 at 08:38 PM
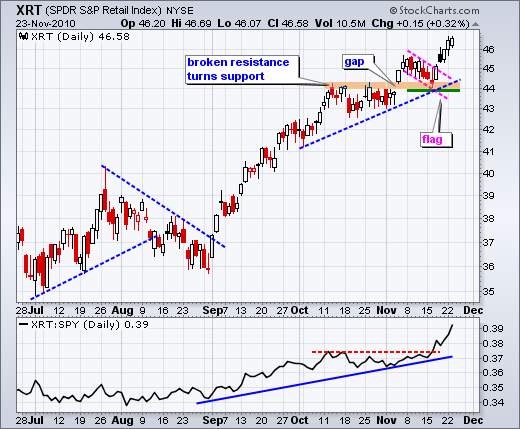
Stocks moved sharply lower on Tuesday, but the Retail SPDR (XRT) bucked the trend and closed with small gain. The chart below shows XRT breaking flag resistance with a gap up four day ago and closing higher the last five days... Read More
Don't Ignore This Chart! November 22, 2010 at 02:07 PM
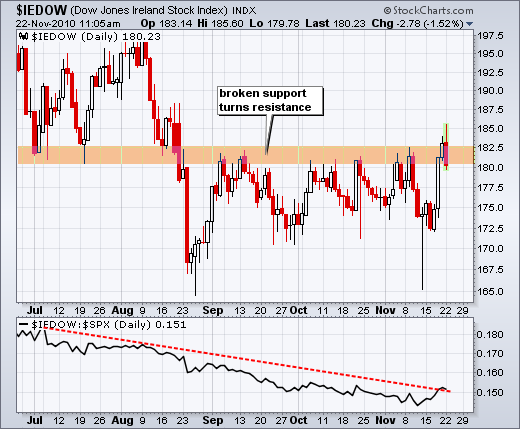
Irish stocks surged to resistance last week, but got cold feet on Monday and reversed course after today's bailout news. The chart below shows the Dow Jones Ireland Index ($IEDOW), which is updated throughout the day... Read More
Don't Ignore This Chart! November 19, 2010 at 02:51 PM
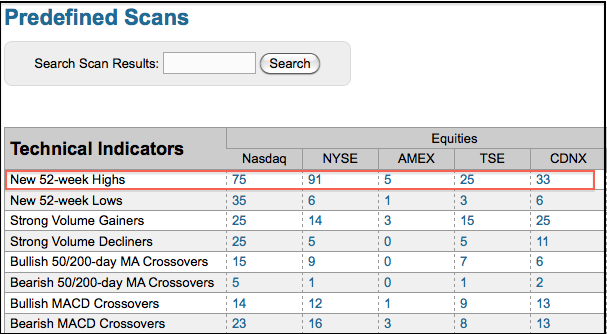
After dipping earlier in the week, Nasdaq and NYSE 52-week highs bounced back with a surge on Thursday. A list of these market leading stocks is posted every day on the pre-defined scans page. There were 75 new highs on the Nasdaq and 91 on the NYSE... Read More
Don't Ignore This Chart! November 18, 2010 at 06:11 PM
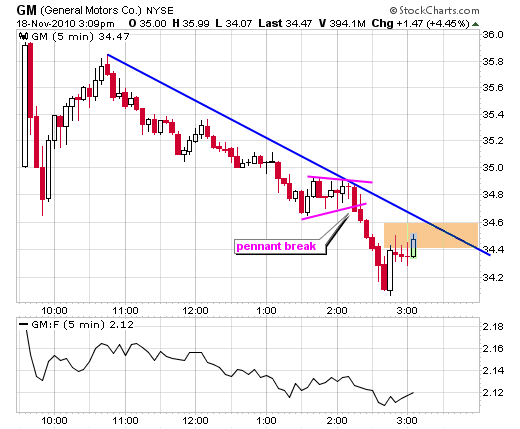
Even though there is not any real historical data for GM, keen chartists can start with the 1-minute and 5-minute charts for the first technical signals. On the 5-min chart, GM is clearly in a downtrend as it trades below the trendline extending down from 10:45AM... Read More
Don't Ignore This Chart! November 17, 2010 at 08:00 PM
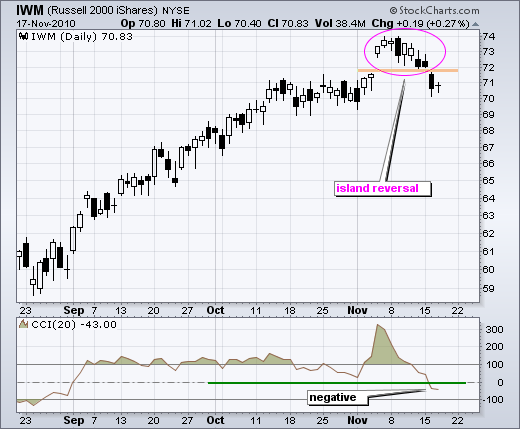
With a gap up, consolidation and gap down over the last two weeks, the Russell 2000 ETF (IWM) forged an island reversal. Notice that there were no trades around 71.8 with the gap up and no trades at this level with the gap down... Read More
Don't Ignore This Chart! November 16, 2010 at 01:57 PM
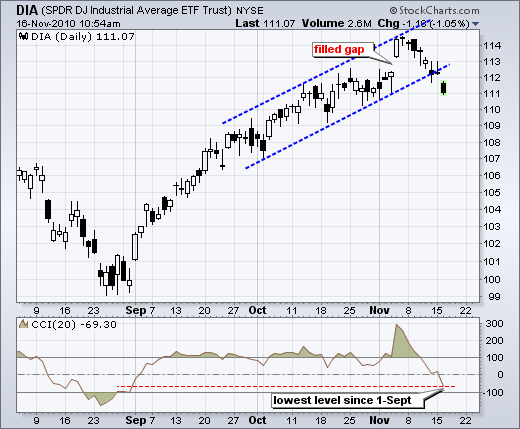
With a sharp decline the last eight days, the Dow Industrials SPDR (DIA) filled the early November gap and broke the channel trendline. Also notice that the Commodity Channel Index (CCI) moved to its lowest level since September 1st... Read More
Don't Ignore This Chart! November 12, 2010 at 02:44 PM
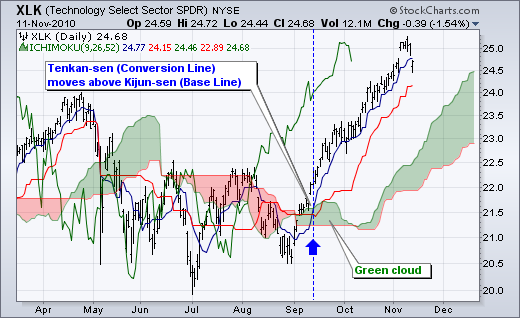
The Technology ETF (XLK) remains in bull mode as it trades above a green cloud and the Tenkan-sen (Conversion Line) holds above the Kijun-sen (Base Line). The Tenkan –sen (blue) is the average of the 9-day high-low range... Read More
Don't Ignore This Chart! November 11, 2010 at 11:37 AM
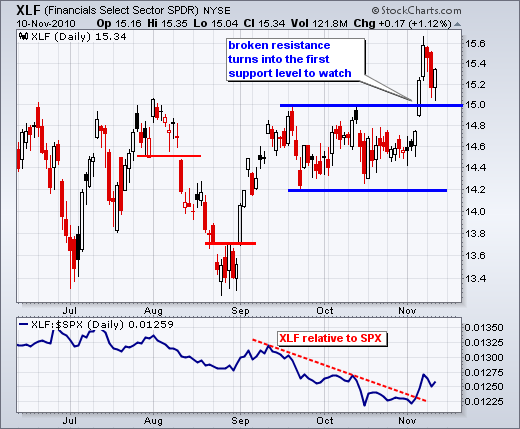
The Finance SPDR (XLF) broke resistance with a big surge last week and broken resistance now turns into the first level to watch for support. This is a basic tenet of technical analysis (broken resistance/support turns into support/resistance)... Read More
Don't Ignore This Chart! November 10, 2010 at 08:04 PM
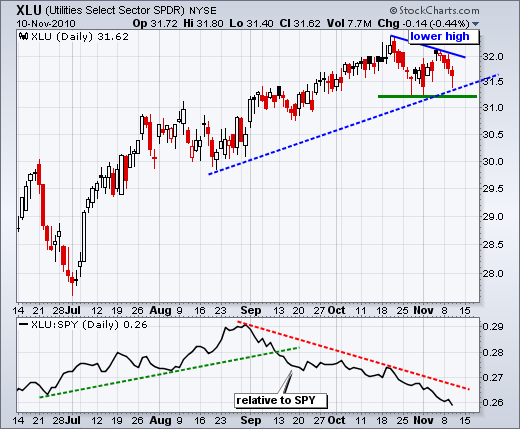
With 30-year Treasury yields moving higher, the interest rate sensitive utilities sector may start feeling the heat. In contrast to the S&P 500, the Utilities SPDR (XLU) peaked in October and formed a lower high in November... Read More
Don't Ignore This Chart! November 09, 2010 at 02:31 PM
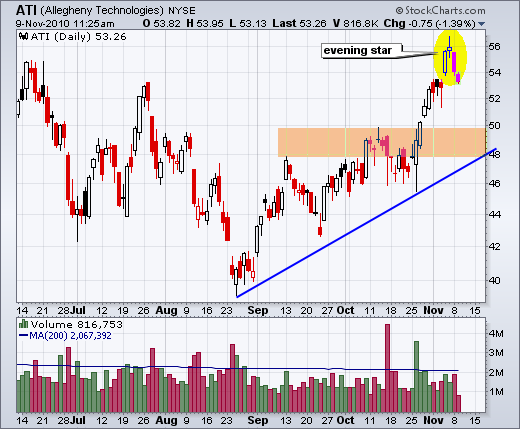
Allegheny Technologies (ATI) formed an evening star over the prior three days. This bearish reversal pattern consists of three candlesticks: a long white candlestick, a small body candlestick and a long red candlestick to complete the reversal... Read More
Don't Ignore This Chart! November 08, 2010 at 08:26 PM
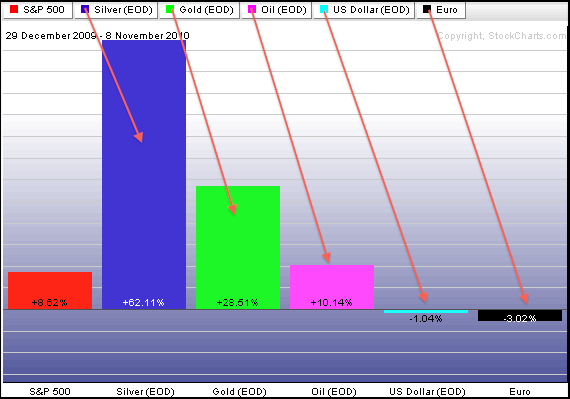
2010 is going to be known as the year of the hard assets. The PerfChart below shows the S&P 500, Silver, Gold, Oil, the Dollar and the Euro. Stocks are up, but lagging the three commodities. Both the Euro Index and the Dollar Index are down for the year... Read More
Don't Ignore This Chart! November 05, 2010 at 03:21 PM
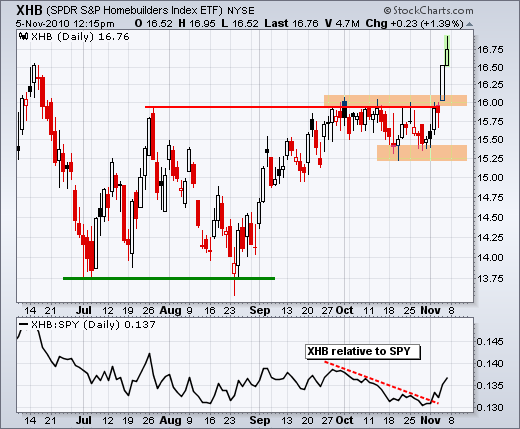
The Homebuilders SPDR (XHB) finally broke above resistance with a surge the last few days. XHB was one of the laggards because it had yet to break its July high. This changed on Thursday as the ETF broke resistance with a gap and long white candlestick... Read More
Don't Ignore This Chart! November 04, 2010 at 06:44 PM
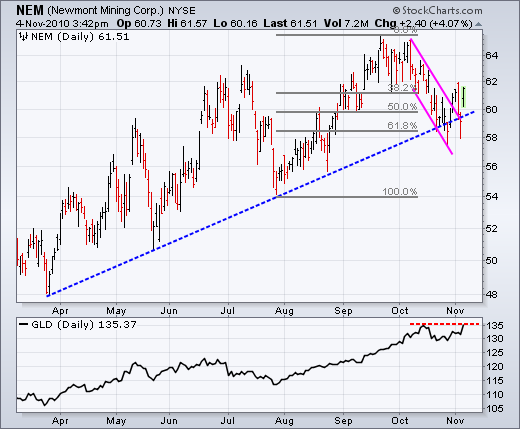
After retracing around 62% of the prior advance, Newmont Mining (NEM) broke above flag resistance with a surge over the last few days. The breakout was under threat with Wednesday's pullback, but Thursday's surge keeps the flag breakout in play. There is one concern... Read More
Don't Ignore This Chart! November 03, 2010 at 08:32 PM
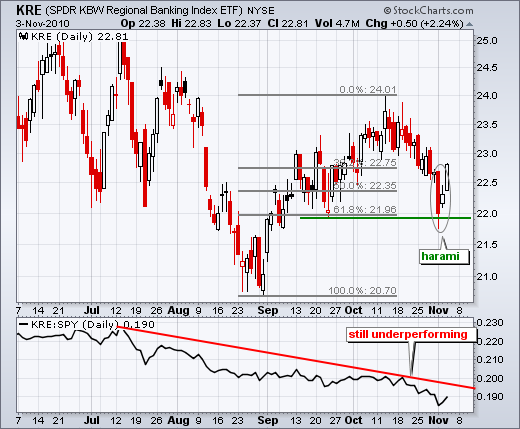
After plunging on Monday, the Regional Bank SPDR (KRE) firmed on Tuesday to form a harami. This is essentially an inside day. Also notice that the ETF managed to firm near the 62% retracement mark. Wednesday's surged above Monday's high confirms the harami... Read More
Don't Ignore This Chart! November 02, 2010 at 08:53 AM
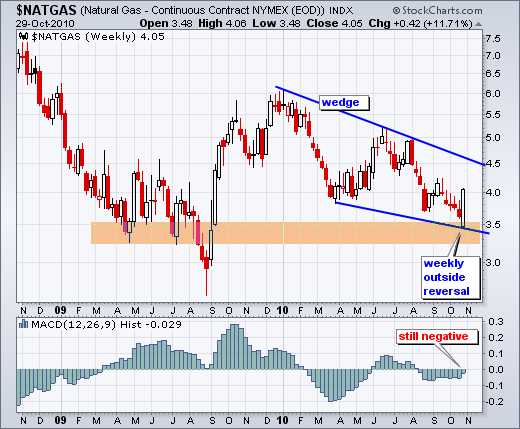
The Natural Gas Continuous-Futures ($NATGAS) formed a large weekly outside reversal pattern last week. Combined with a falling wedge and support in the 3.3-3.5 area, Natural Gas is threatening a bounce within its long downtrend... Read More
Don't Ignore This Chart! November 01, 2010 at 11:45 AM
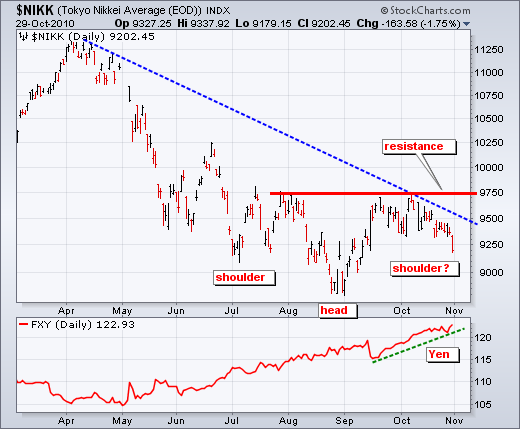
The Nikkei 225 ($NIKK) failed at resistance as the Yen surged to new highs. The Nikkei 225 surged in September, but never broke resistance as a weak Dollar drove the Yen higher... Read More