Don't Ignore This Chart! March 31, 2011 at 07:09 PM
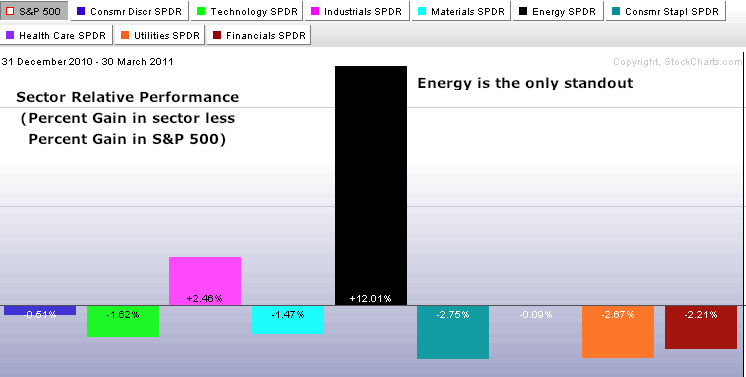
The sector PerfChart shows the relative performance of the nine sectors. Relative performance equals the sector gain less the gain in the S&P 500. Year-to-date, the energy sector is the only standout performer... Read More
Don't Ignore This Chart! March 30, 2011 at 08:18 PM
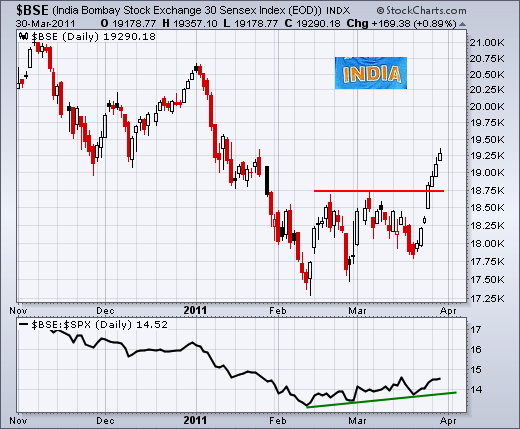
The India Sensex Index ($BSE) is celebrating India's semi-final win in the Cricket World Cup with a breakout over the last few days. Actually, the breakout occurred before the win. Stocks tend to lead major sporting events by a few days (joke)... Read More
Don't Ignore This Chart! March 29, 2011 at 02:35 PM
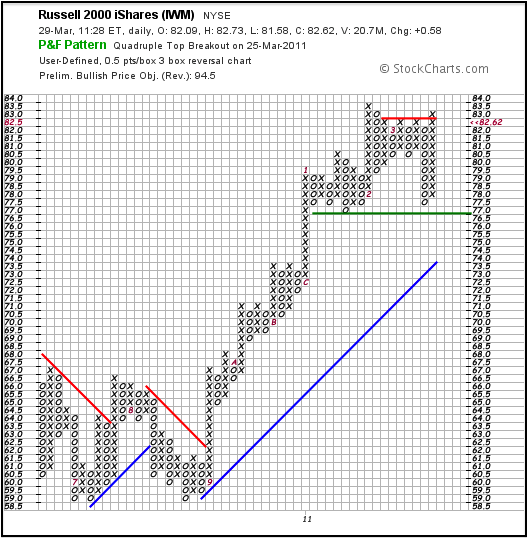
On the P&F chart, the Russell 2000 ETF affirmed support around 77 with a sharp reversal the last two weeks. This reversal was strong enough to forge a Quadruple Top Breakout as the current X-Column broke above the equal highs of the prior three X-Columns... Read More
Don't Ignore This Chart! March 28, 2011 at 02:01 PM
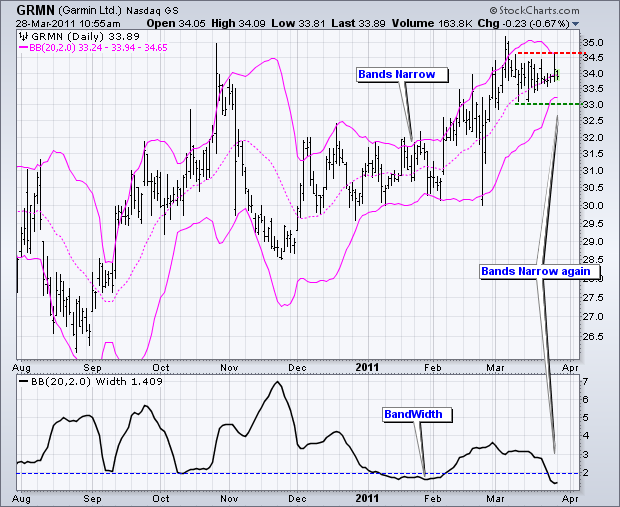
After surging above its October high, Garmin moved into a consolidation and volatility contracted. Notice how Bollinger Band Width moved below the January low and to its lowest level in months. This volatility contraction could foreshadow a volatility expansion... Read More
Don't Ignore This Chart! March 25, 2011 at 03:51 PM
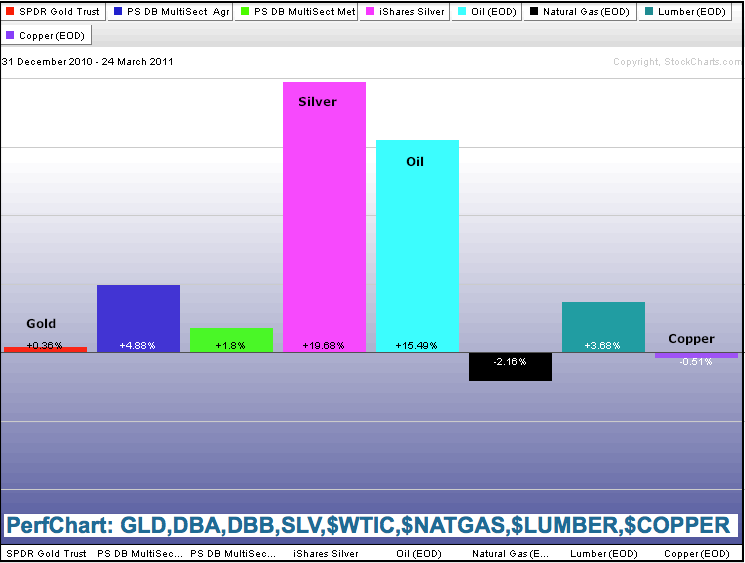
The year-to-date commodity PerfChart shows Silver and Oil as the big winners. Both are up more than 15%. Gold is also up, but barely as it finished 2010 near $1420. A surge over the last two weeks brought Copper back to its 2010 high... Read More
Don't Ignore This Chart! March 24, 2011 at 03:24 PM
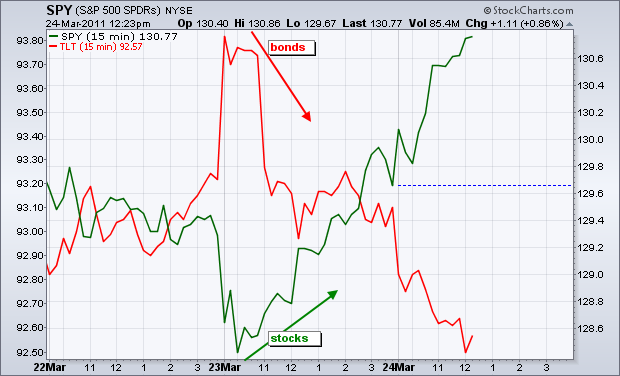
After a gap down and weak open on Wednesday, the stock bulls found their wind and pushed stocks higher. At the same time, the bond bulls lost their wind as the 20+ year Bond ETF (TLT) moved sharply lower... Read More
Don't Ignore This Chart! March 23, 2011 at 09:15 PM
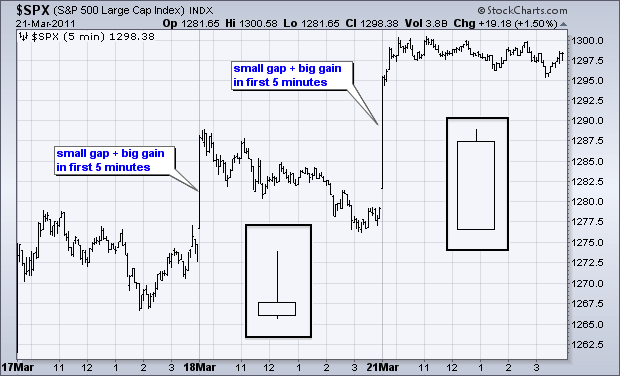
Even though the S&P 500 and the S&P 500 ETF (SPY) track quite well over the medium-term and long-term, daily candlestick action can be quite different. The S&P 500 is an index that prints a price seconds after the market open... Read More
Don't Ignore This Chart! March 23, 2011 at 08:23 PM
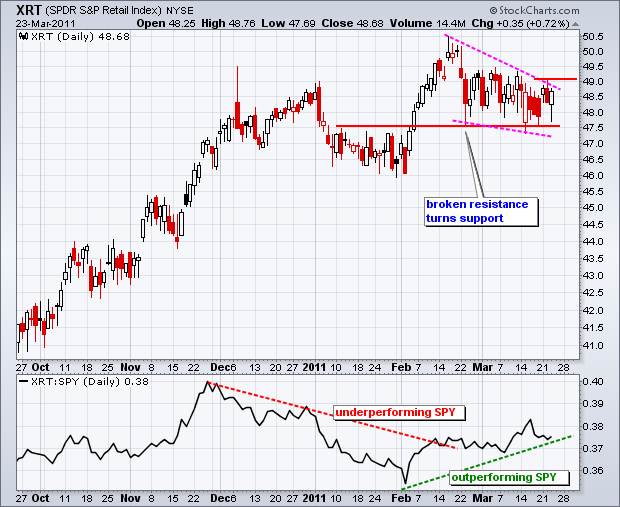
The Retail SPDR (XRT) held up quite well in March as broken resistance turned into support at 47.5 the last few weeks. After a surge in early February, a falling wedge evolved and the ETF established resistance at 49.10 this week... Read More
Don't Ignore This Chart! March 22, 2011 at 06:36 PM
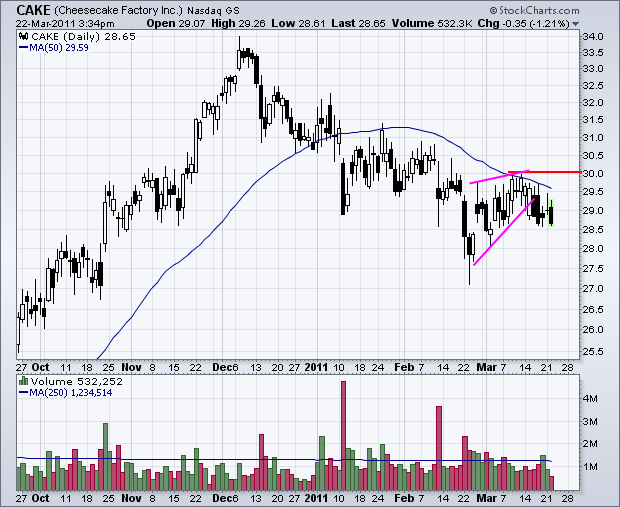
Sometimes the 50-day SMA works like a charm for support/resistance and other times not. Cheesecake Factory (CAKE) appears to be in the former category. The stock formed a rising wedge in March, met resistance at the 50-day last week and turned lower the last four days... Read More
Don't Ignore This Chart! March 21, 2011 at 02:57 PM
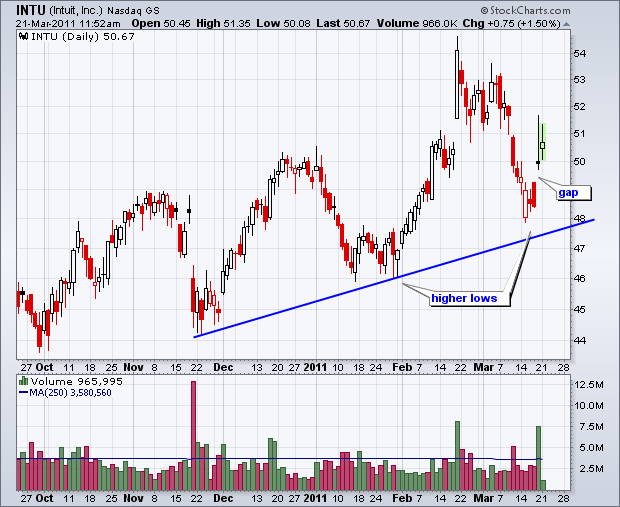
Intuit (INTU) surged on Friday with a nice gap on the highest volume of the month. With a higher low forming around 48, the overall uptrend remains in place. As they say on the London Tube: mind the gap. This gap is bullish as long as it holds... Read More
Don't Ignore This Chart! March 18, 2011 at 01:35 PM
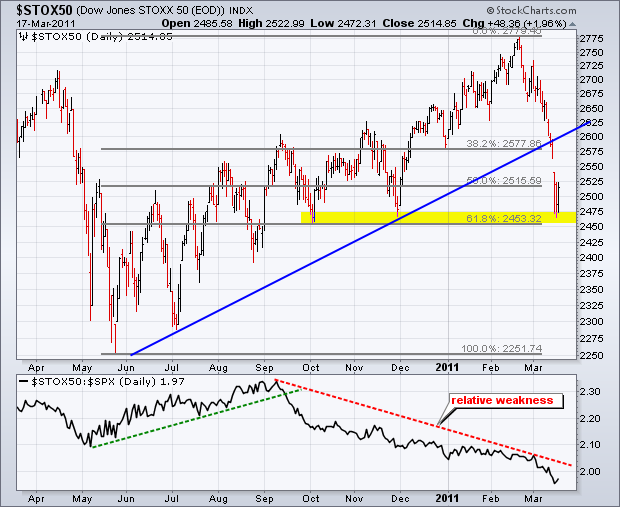
After falling off the cliff the last few weeks, the DJ Stoxx 50 Index hit support from a familiar retracement. The decline to around 2460 retraced 62% of the prior advance. There is also support in this area from the October-November lows... Read More
Don't Ignore This Chart! March 17, 2011 at 03:42 PM
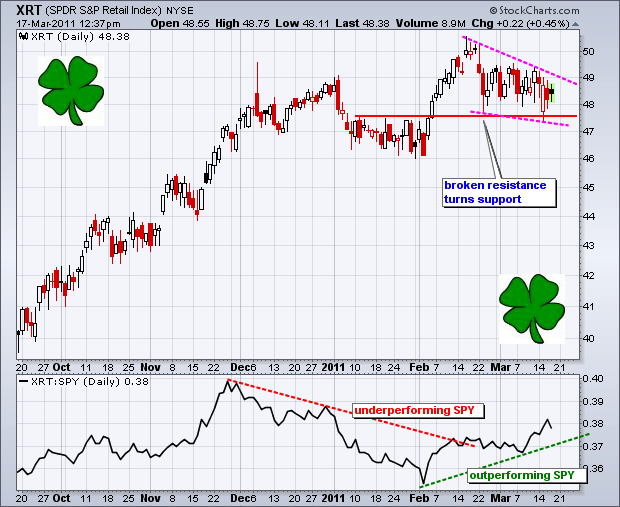
After breaking resistance with a surge in early February, the Retail SPDR (XRT) returned to the breakout with a decline the last few weeks. This decline is tracing out a falling wedge pattern... Read More
Don't Ignore This Chart! March 16, 2011 at 08:18 PM
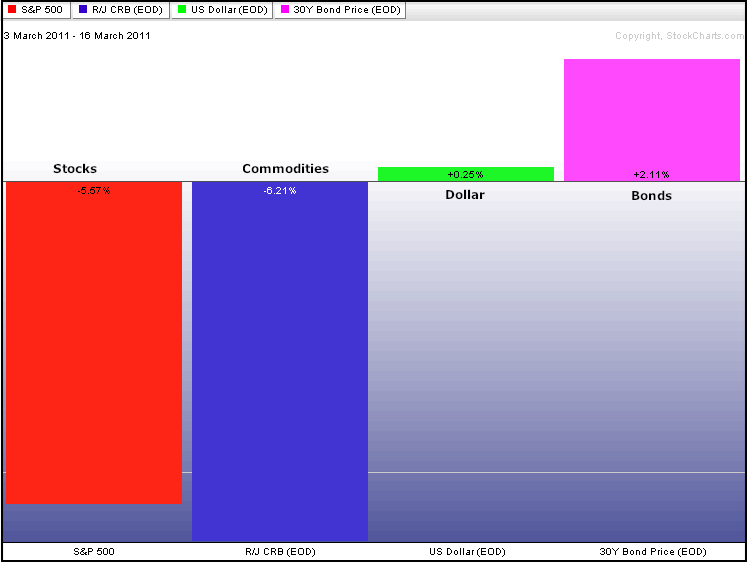
John Murphy's Intermarket Study PerfChart shows money moving out of stocks and commodities over the last two weeks. Weakness in the CRB Index gave a little lift to the Dollar and a flight-to-safety provided a serious lift for bonds... Read More
Don't Ignore This Chart! March 15, 2011 at 07:43 PM
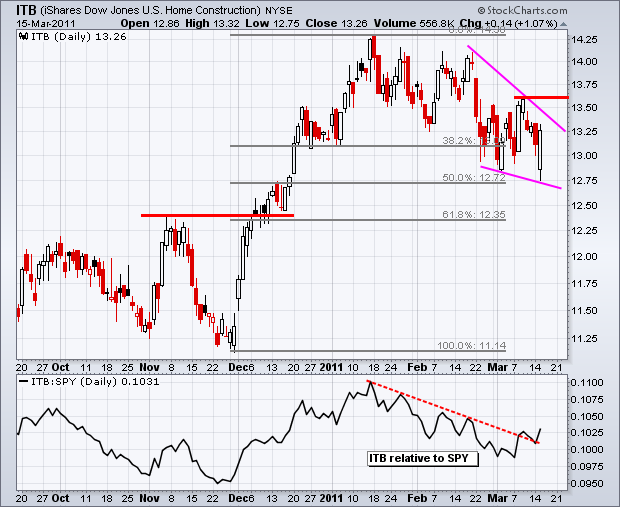
The Home Construction iShares (ITB) opened weak with a gap below 13, but recovered its early losses and closed with a 1.07% gain on the day. Not bad considering the circumstances... Read More
Don't Ignore This Chart! March 14, 2011 at 05:25 PM
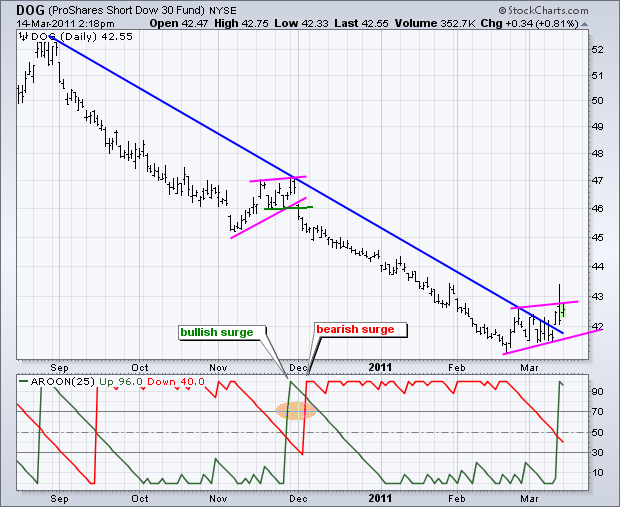
Unsurprisingly, the ProShares Short Dow 30 Fund (DOG) moved lower as the market trended higher from September to February. As with November, the ETF is making another reversal attempt as it broke the late August trendline and Aroon(Up) surged above 90... Read More
Don't Ignore This Chart! March 11, 2011 at 04:19 PM
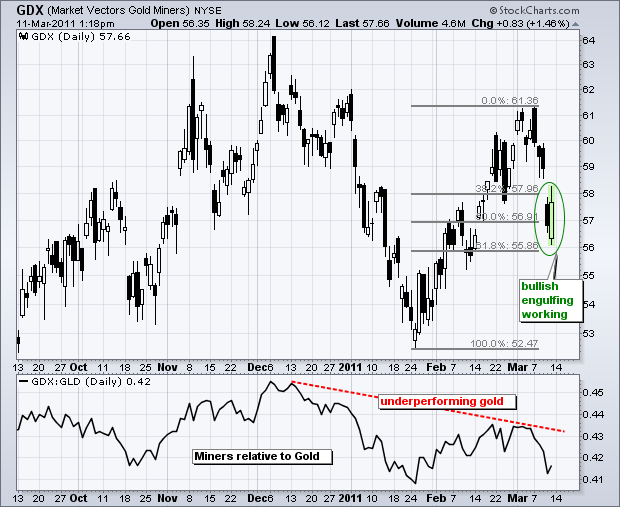
After a sharp decline the first four days of the week, the Gold Miners ETF (GDX) quickly firmed on Friday with a bullish engulfing taking shape Friday afternoon (1:18PM). Also note that this pattern formed with a low at the 62% retracement mark... Read More
Don't Ignore This Chart! March 10, 2011 at 05:26 PM
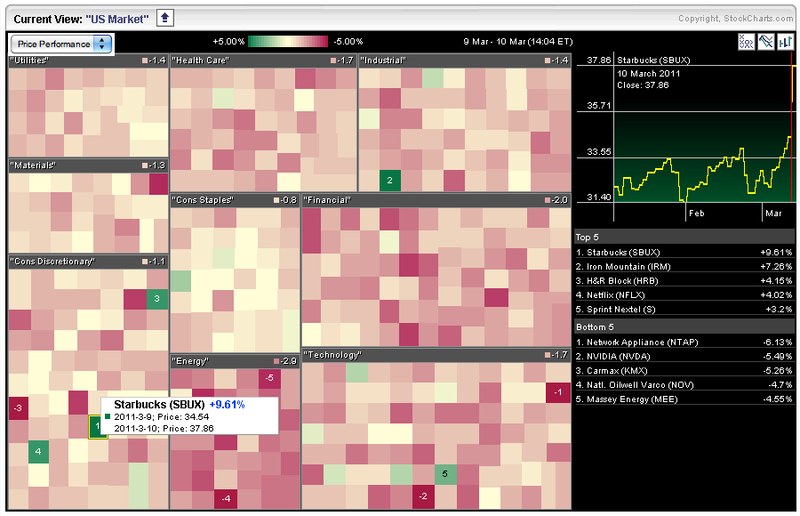
Stocks are down sharply as of this writing, but there are a few bucking the trend with gains. Chartists can find such rogue stocks with the Sector Market Carpet. The green squares show the gainers and the top five are listed to the right... Read More
Don't Ignore This Chart! March 09, 2011 at 08:01 PM
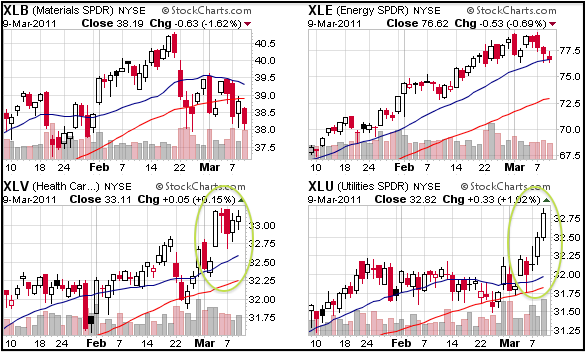
CandleGlance charts provide a quick group snapshot. The screenshot comes from the S&P Sector SPDR CandleGlance group. Only four of the nine are shown. Click the image to see all... Read More
Don't Ignore This Chart! March 08, 2011 at 06:14 PM
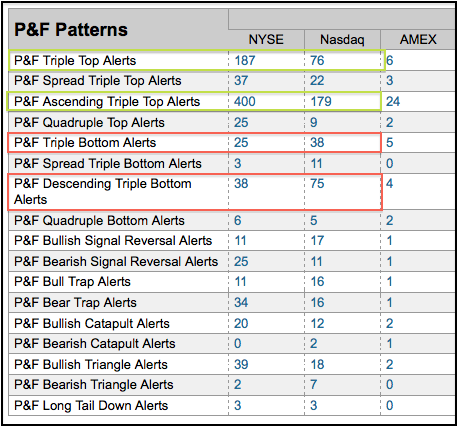
There are 17 P&F related scans on the pre-defined scans page. Of the major patterns shown below, the first four patterns are bullish and the second four are bearish... Read More
Don't Ignore This Chart! March 07, 2011 at 07:59 PM
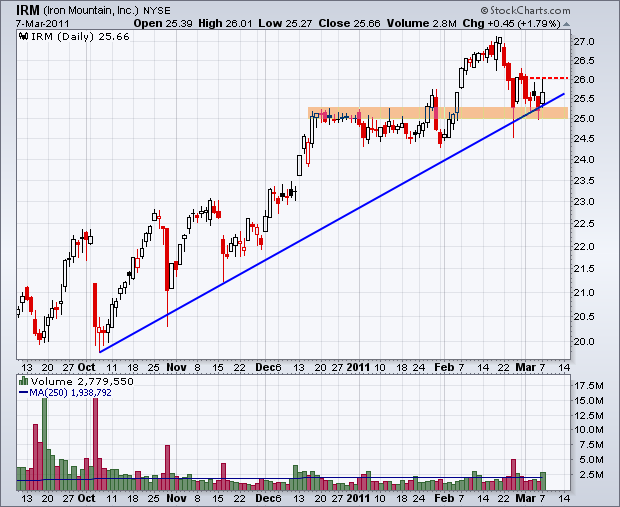
Stocks were broadly lower on Monday, but a few bucked the trend with gains. Simply scanning for stocks that gained on a day like today will reveal those showing some relative strength... Read More
Don't Ignore This Chart! March 04, 2011 at 03:58 PM
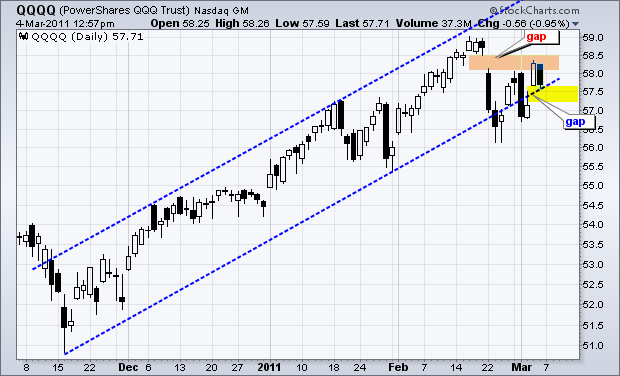
For the second time in two weeks, the Nasdaq 100 ETF (QQQQ) surged and met resistance from the 22-Feb gap. While failure at the gap is negative, the overall trend remains up as QQQQ battles the lower trendline of a rising price channel... Read More
Don't Ignore This Chart! March 03, 2011 at 06:06 PM
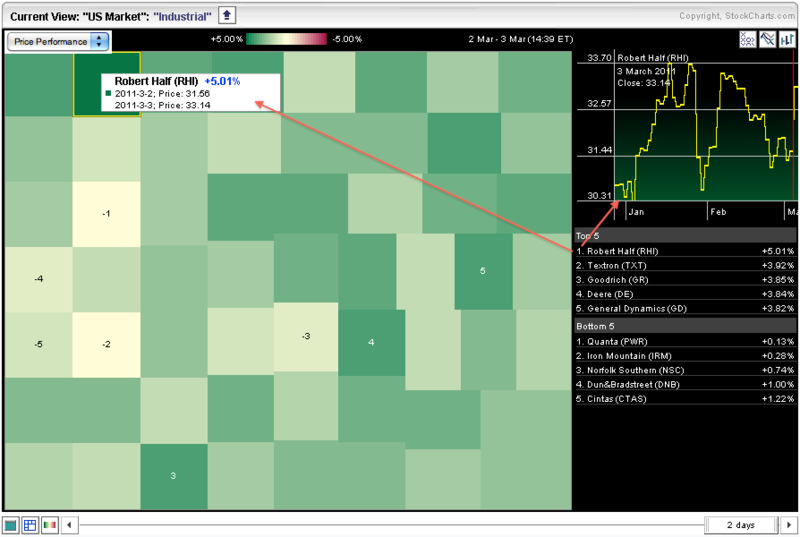
The S&P Sector Market Carpet provides an easy visual to identify the leaders and laggards over a given timeframe. Clicking on the sector name puts the focus on that sector. Hover over the squares to see the name, ticker and percent change... Read More
Don't Ignore This Chart! March 02, 2011 at 12:11 PM
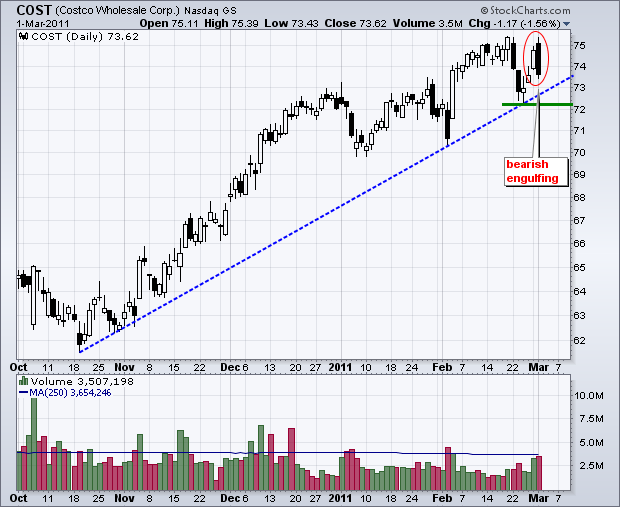
A bearish engulfing forms when a long black candlestick engulfs the body of the prior white candlestick. This means the open is above the prior close and the close is below the prior open. It is a reversal day that can foreshadow lower prices... Read More
Don't Ignore This Chart! March 01, 2011 at 05:43 PM
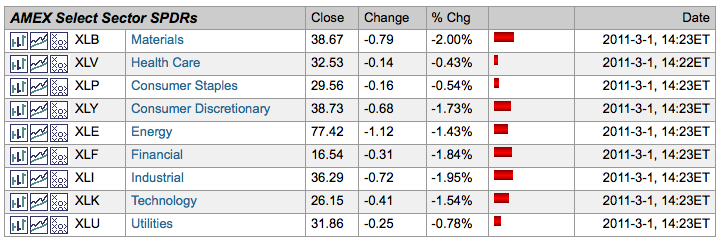
All sectors were down in afternoon trading on Tuesday, but some were down less than others. In particular, the Utilities SPDR (XLU), Consumer Staples SPDR (XLP) and Healthcare SPDR (XLV) were holding up relatively well with modest losses... Read More
Don't Ignore This Chart! February 28, 2011 at 08:26 PM
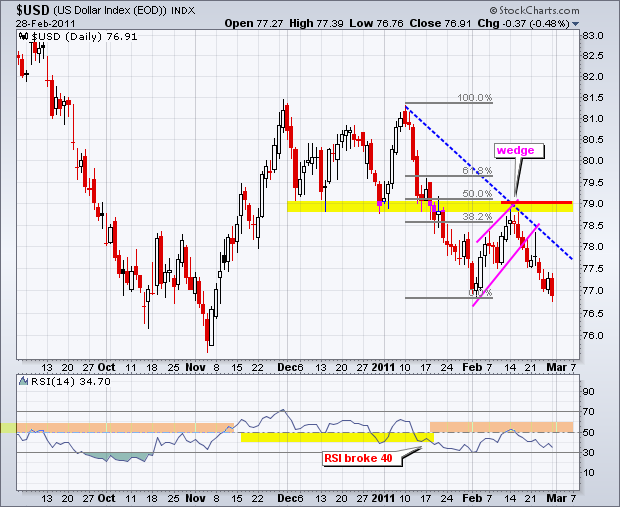
The US Dollar Index ($USD) extended its losses on Monday with a decline below 77. After a two week fall, the index is near its early February low. This level may offer support, but the trend is clearly down after the failure at 79 and wedge break... Read More