Don't Ignore This Chart! May 31, 2011 at 12:31 PM
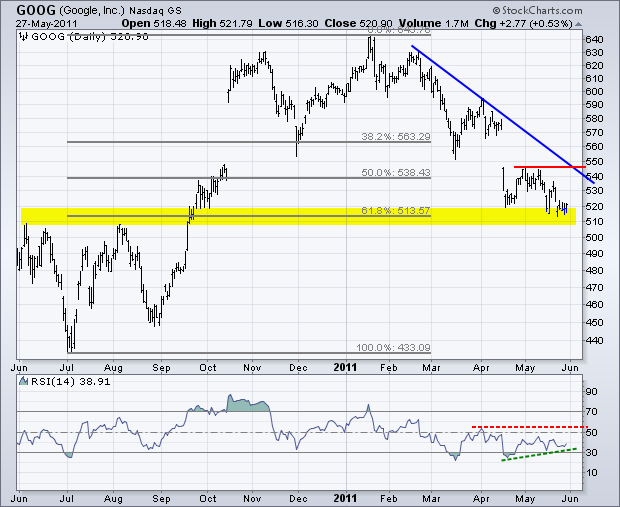
Google ($GOOG) has been trending lower since mid January, but support may be at hand in the 515 area. Broken resistance and the 62% retracement combine to mark support here. Also notice that RSI has a bullish divergence working the last few weeks... Read More
Don't Ignore This Chart! May 27, 2011 at 02:39 PM
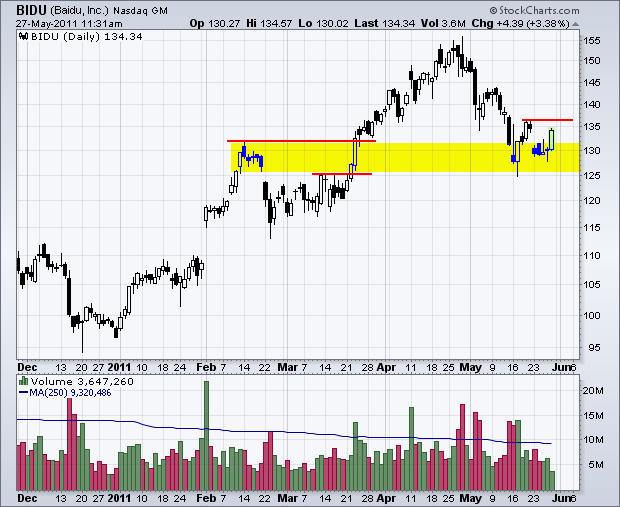
A basic tenet of technical analysis is that broken resistance turns into support. Biadu broke two resistance levels and these combine to form a support zone. With the stock firming the last two week, watch for a bounce above the mid May high to reverse the May slide... Read More
Don't Ignore This Chart! May 26, 2011 at 05:47 PM
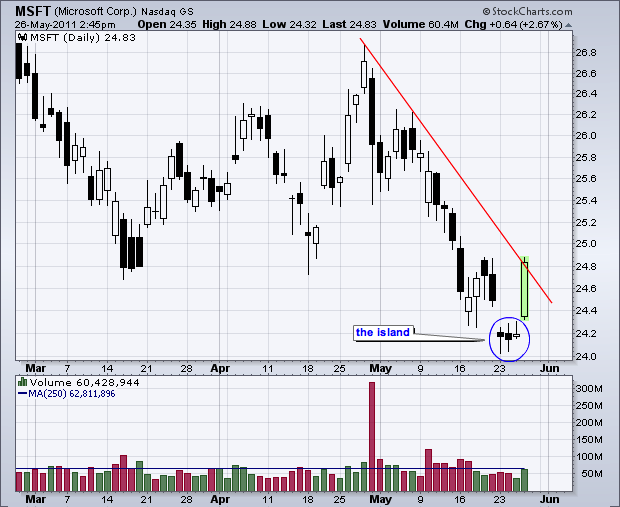
With a gap down, three day stall and gap up, Microsoft (MSFT) forged a bullish island reversal. Technically, the high of the 3-day consolidation is 24.31 and today's low is 24.32. The gap zone is one cent. Nevertheless, the essence of a island reversal is there... Read More
Don't Ignore This Chart! May 25, 2011 at 08:24 PM
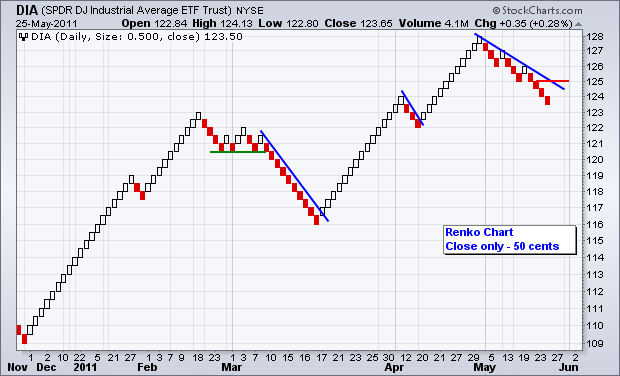
Renko charts filter out the noise by requiring minimum price moves before the plot changes. This Renko chart shows the Dow Industrials SPDR (DIA) based on closing prices with 50 cents as the minimum move. A clear decline has taken shape in May with resistance at 125... Read More
Don't Ignore This Chart! May 24, 2011 at 06:34 PM
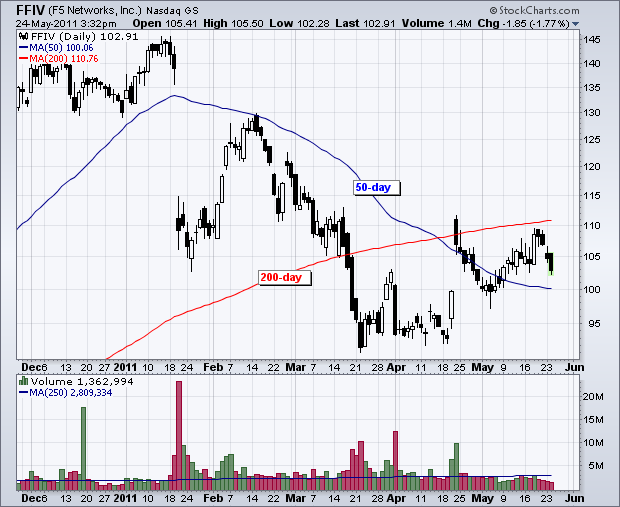
F5 Networks (FFIV) first broke below its 50-day SMA in January and then its 200-day moving average in March. The stock recovered with a break back above the 50-day in May, but has yet to reclaim the 200-day... Read More
Don't Ignore This Chart! May 23, 2011 at 01:32 PM
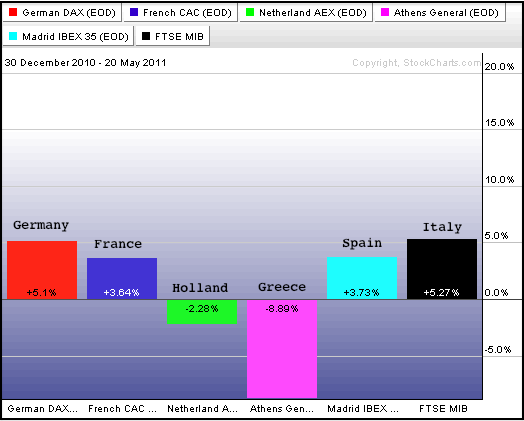
The PerfChart shows the year-to-date performance for six European stock indices. Surprisingly, the Italian Milan Index ($MIB) is the best performing. Germany is a close second though... Read More
Don't Ignore This Chart! May 20, 2011 at 03:09 PM
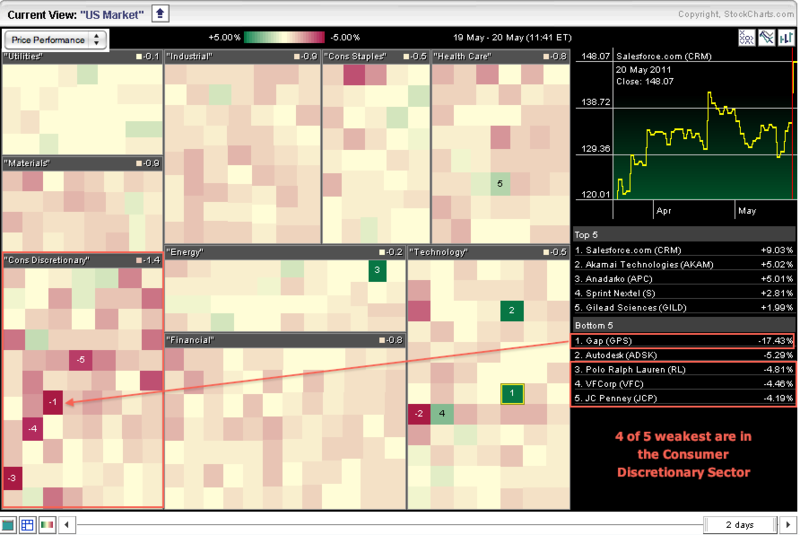
The consumer discretionary sector is seeing serious red over the last two days. The S&P Sector Carpet shows 2-day price performance for various stocks in the nine sectors. Four of the five weakest stocks come from this most economically sensitive sector... Read More
Don't Ignore This Chart! May 19, 2011 at 06:33 PM
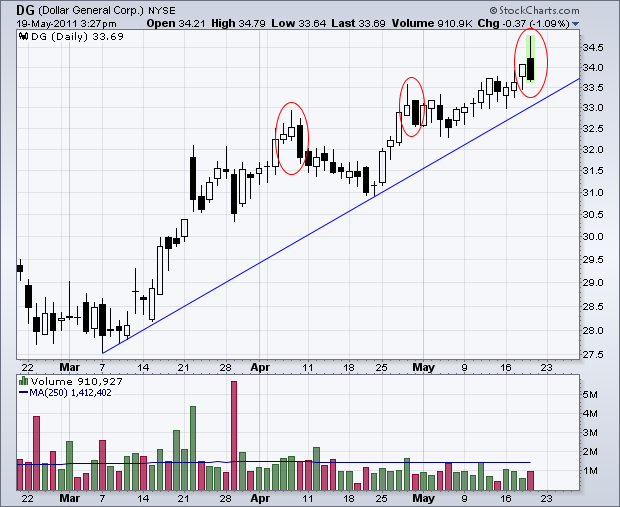
With a strong open and decline into the close, Dollar General (DG) is set form a bearish engulfing pattern with a long upper shadow. This is the third such pattern in the last two months. Watch the trendline extending up from the March low for a break to confirm this pattern... Read More
Don't Ignore This Chart! May 18, 2011 at 01:42 PM
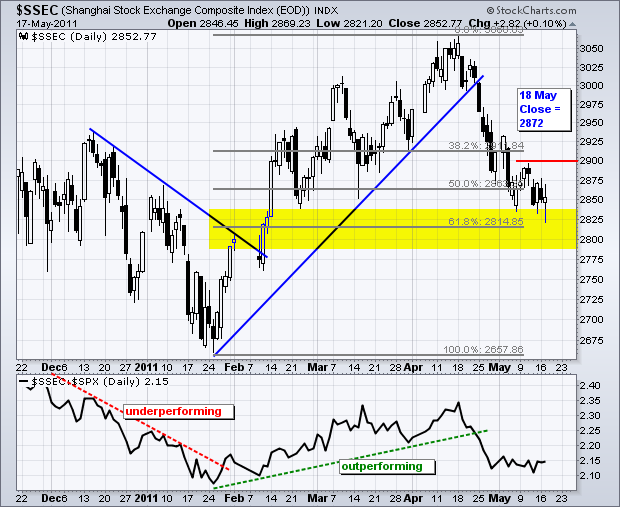
With a 6.5% decline from its April high, the Shanghai Composite ($SSEC) has been one of the weaker world indices this spring. Despite relative weakness, the index is trying to firm in a support zone that centers around the 62% retracement... Read More
Don't Ignore This Chart! May 17, 2011 at 05:49 PM
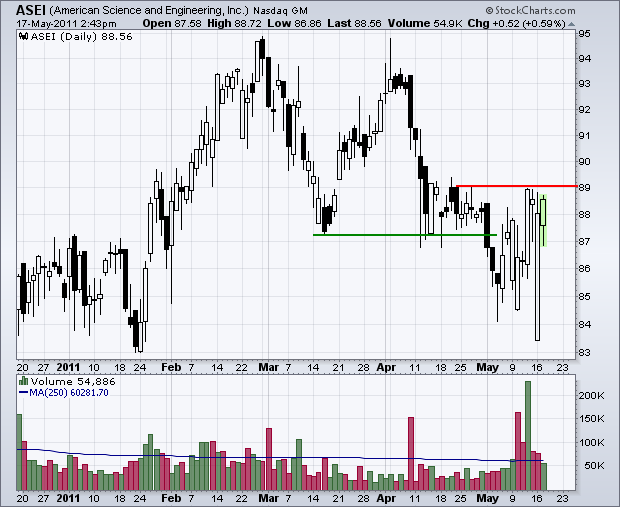
American Science and Engineering ($ASEI) broke support at the beginning of May, but the bulls are not giving up easily as the stock formed at least four really long white candlesticks since then. A long white or hollow candlestick indicates that the close is above the open... Read More
Don't Ignore This Chart! May 16, 2011 at 10:48 AM
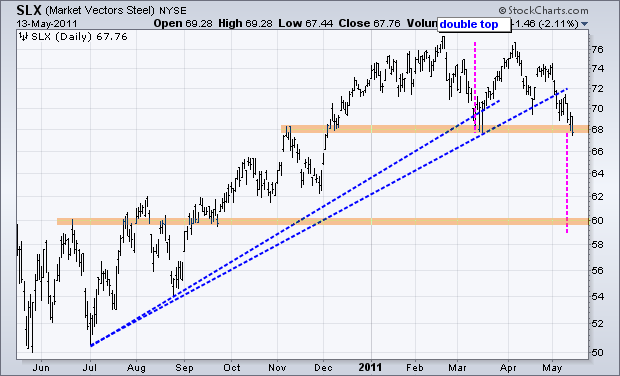
The Steel ETF (SLX) traced out a double top with two relatively equal highs this year. The intermittent low formed in March to mark key support for this pattern. SLX closed right at this low on Friday for an important test... Read More
Don't Ignore This Chart! May 13, 2011 at 08:41 PM
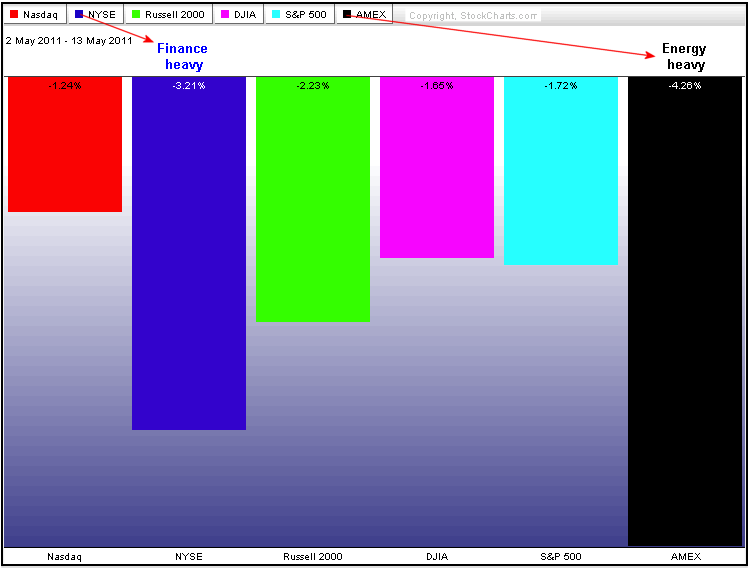
Of the five broad market indices, the Amex is the weakest due to declines in energy related shares this month. The Amex is heavily weighted towards the energy sector. The NY Composite ($NYA) is the second weakest index... Read More
Don't Ignore This Chart! May 12, 2011 at 10:00 AM
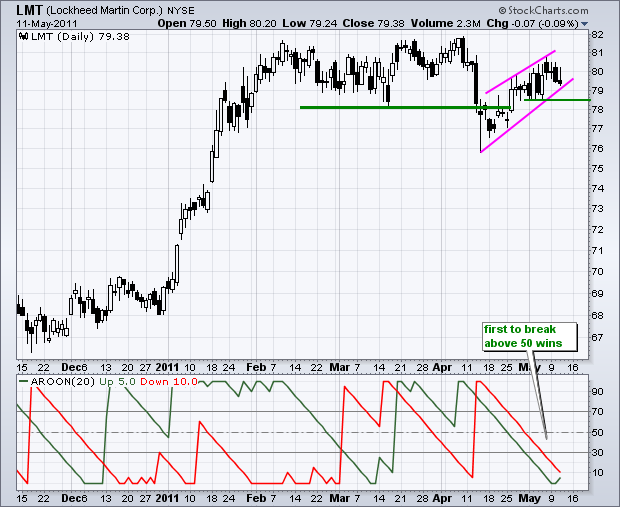
Even though Lockheed Martin (LMT) edged higher the last few weeks, both Aroon Up (green) and Aroon (down) moved lower. Also notice that they are parallel and relatively close together. This affirms the consolidation in LMT... Read More
Don't Ignore This Chart! May 11, 2011 at 10:00 AM
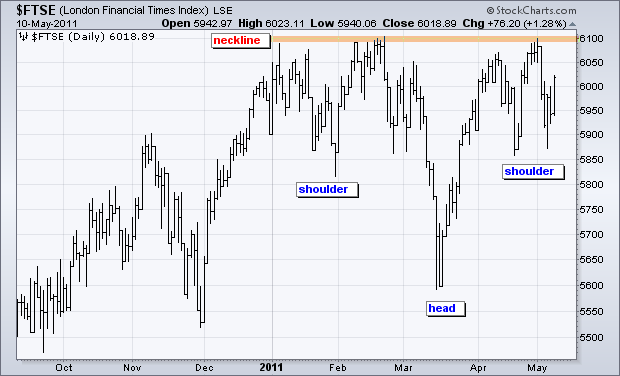
The London FTSE 100 ($FTSE) found support near its January-February lows over the last few weeks. With a deeper dip in March, an inverse head-and-shoulders pattern is taking shape in 2011. A break above 6100 (neckline) would signal a continuation higher... Read More
Don't Ignore This Chart! May 10, 2011 at 10:00 AM
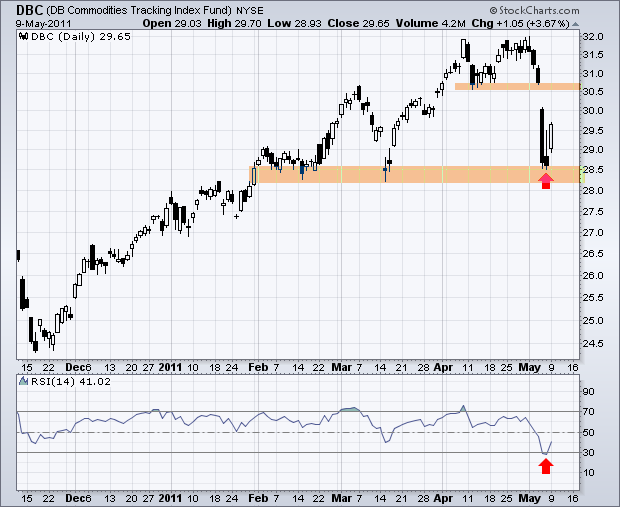
After becoming oversold last week, the DB Commodity Index Fund ($DBC) bounced off support with a long white candlestick. Notice that an inverted hammer formed on Friday as RSI dipped below 30 (oversold). Broken support turns into the first resistance area around 30.50... Read More
Don't Ignore This Chart! May 09, 2011 at 10:00 AM
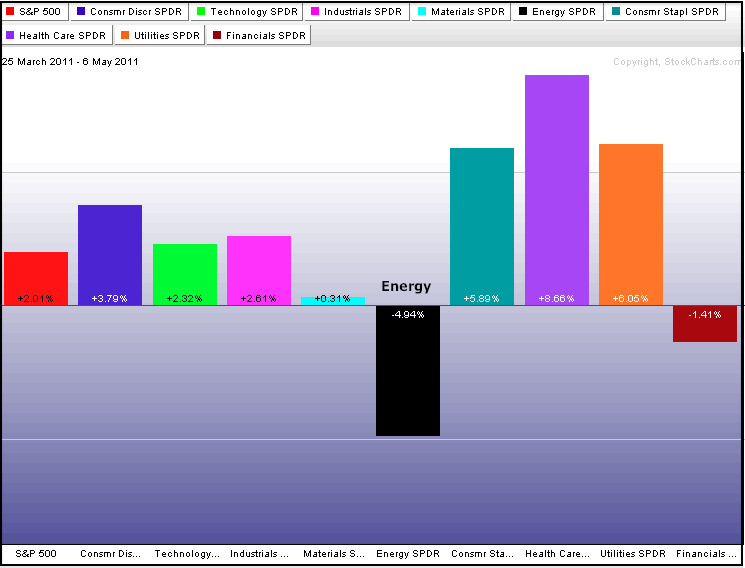
The Energy SPDR (XLE) is still one of the leading sectors in 2011, but the ETF has started showing relative weakness over the last 30 trading days. The PerfChart below shows XLE as the weakest of the nine sectors since March 25th. All sectors are up, but XLE is down almost 5%... Read More
Don't Ignore This Chart! May 06, 2011 at 03:00 AM
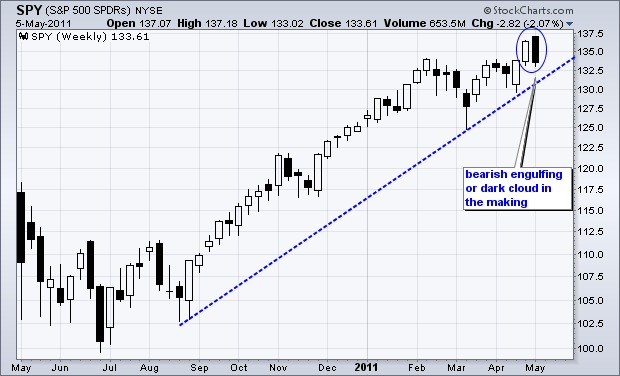
With a strong open on Monday and weakness the rest of the week, the S&P 500 ETF (SPY) formed a long black candlestick that engulfed the prior white candlestick. The week is not yet finished because Friday remains... Read More
Don't Ignore This Chart! May 05, 2011 at 01:58 PM
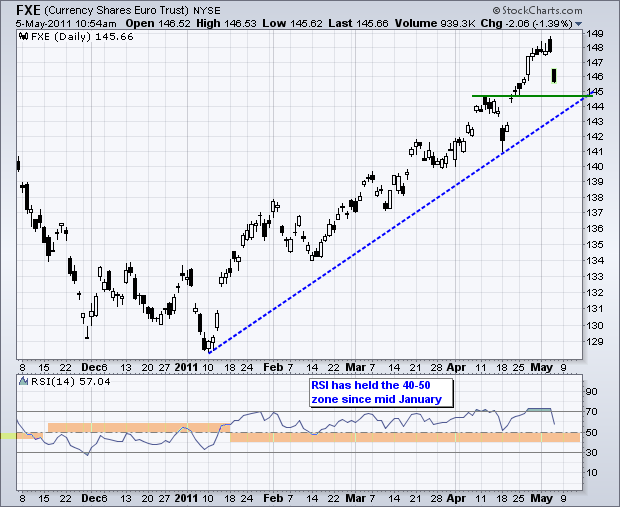
The Euro Currency Trust (FXE) hit a new 52-week high Wednesday, but gave it all back with a sharp decline early Thursday. As of 11AM ET Thursday, FXE is down around 2% from Wednesday's high. That's quite a drop... Read More
Don't Ignore This Chart! May 04, 2011 at 04:09 PM
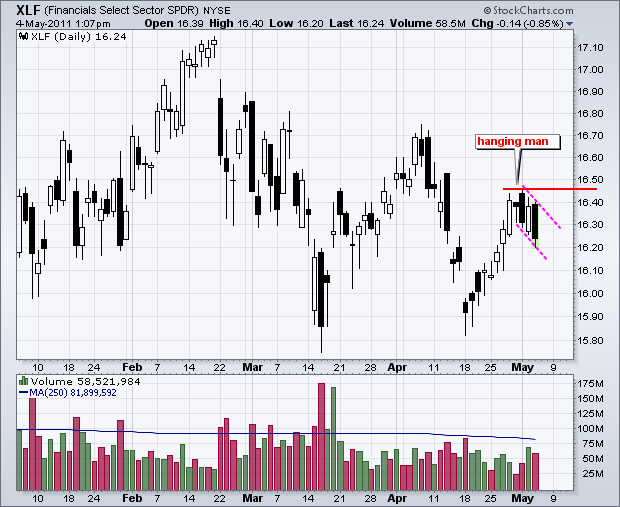
After a bounce off support in April, the Finance SPDR (XLF) came under pressure with a hanging man at the end of April and a bearish engulfing at the beginning of May. These two bearish candlesticks affirm resistance from the early May high... Read More
Don't Ignore This Chart! May 03, 2011 at 05:40 PM
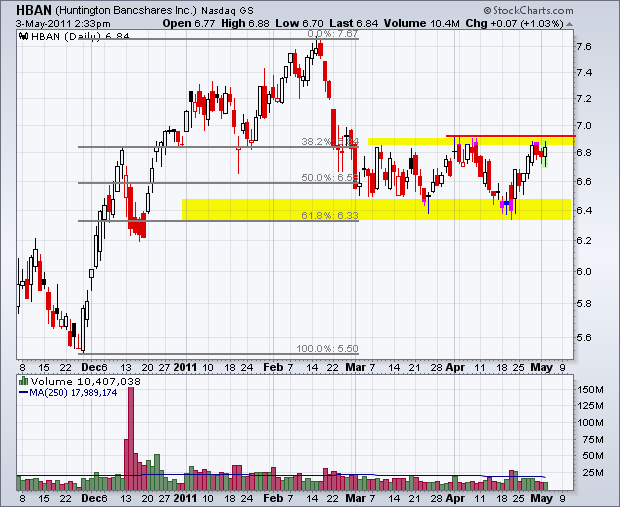
After going nowhere for two months, Huntington Bancshares (HBAN) is once again battling consolidation resistance. The stock has been stuck between 6.3 and 6.9 since the beginning of March... Read More
Don't Ignore This Chart! May 02, 2011 at 06:49 PM
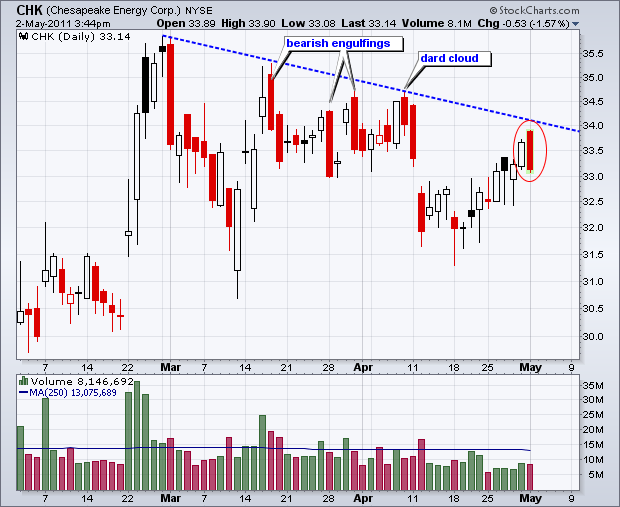
After surging in late February, Chesapeake (CHK) worked its way lower with three bearish engulfings and a dark cloud pattern. The April bounce above 33.5 may be stymied as the stock formed another bearish engulfing on Monday. Check out our bearish engulfing scan for more... Read More