Don't Ignore This Chart! June 30, 2011 at 08:49 AM
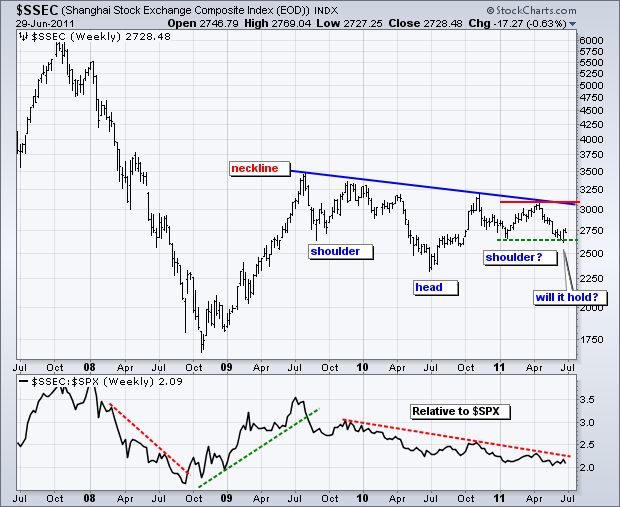
The Shanghai Composite ($SSEC) has been drifting lower since July 2009, with a decline that looks like an inverse Head-and-Shoulders pattern. The neckline is sloping down, which affirms the current downtrend... Read More
Don't Ignore This Chart! June 29, 2011 at 07:00 PM
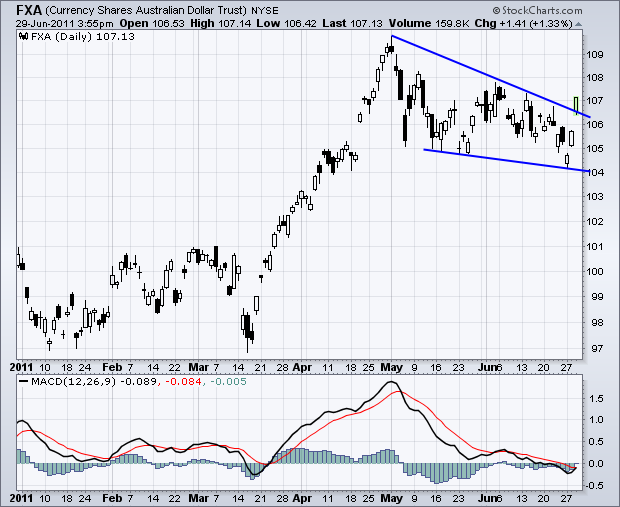
With commodities on the rebound this week, the Australian Dollar Trust (FXA) surged over the last two days and broke the upper trendline of a falling wedge. The Aussie Dollar, Canadian Dollar, New Zealand Dollar and S... Read More
Don't Ignore This Chart! June 28, 2011 at 06:38 AM
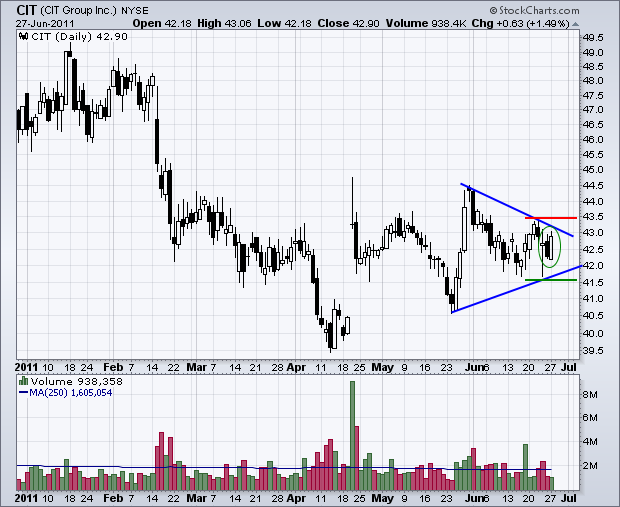
With a weak open and strong close in the stock market, quite a few stocks made the Bullish Engulfing and Piercing Pattern scans. In particular, CIT Group (CIT) formed a bullish engulfing within a triangle pattern... Read More
Don't Ignore This Chart! June 27, 2011 at 07:41 PM
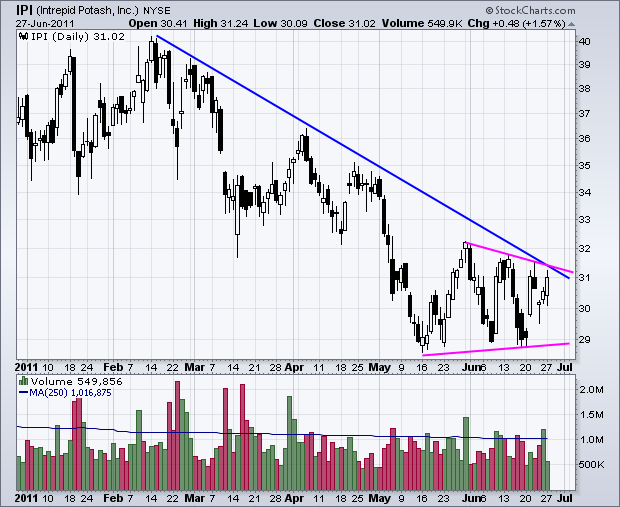
Intrepid Potash (IPI) formed a volatile triangle within a downtrend. The trendline extending down from the February high and the upper trendline of the triangle converge to mark resistance. There could very well be a failure here. Alternatively, watch this level for a breakout... Read More
Don't Ignore This Chart! June 23, 2011 at 08:13 PM
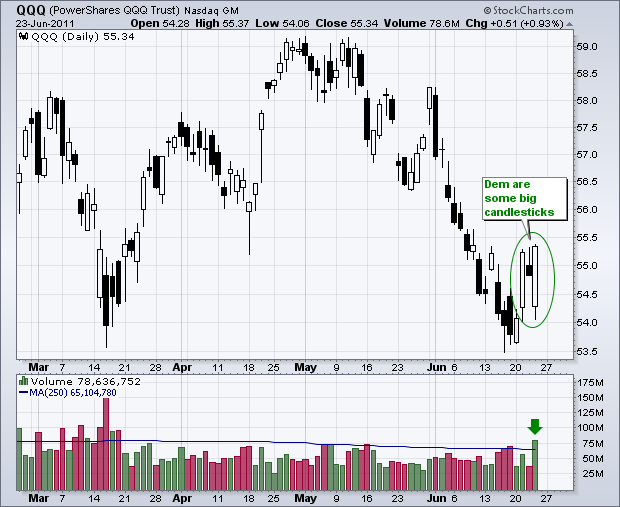
With a weak open and strong close, the Nasdaq 100 ETF (QQQ) formed a long white candlestick that is just as long as Tuesday's candlestick. Volume surged to its highest level since mid March. The lows of these two candlesticks now mark an important short-term support level... Read More
Don't Ignore This Chart! June 22, 2011 at 06:29 PM
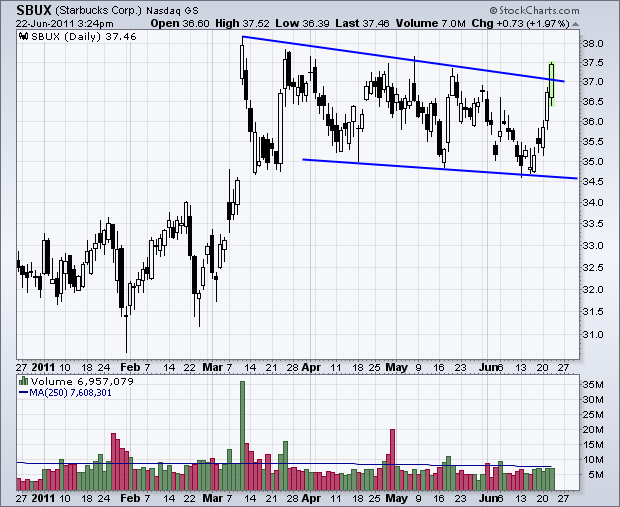
Starbucks (SBUX) got a jolt over the last five days with a surge above the upper trendline of a falling channel... Read More
Don't Ignore This Chart! June 21, 2011 at 03:11 PM
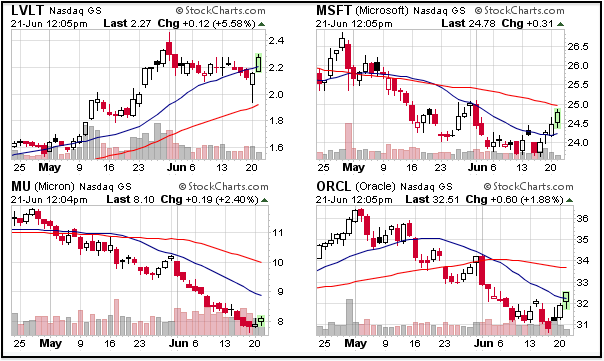
From the Free Charts page, we can see that the 10 most active Nasdaq and NYSE stocks are up in early trading on Tuesday. Gains are especially strong on the Nasdaq. The image below comes from the CandleGlance link just under the most active list... Read More
Don't Ignore This Chart! June 20, 2011 at 08:46 PM
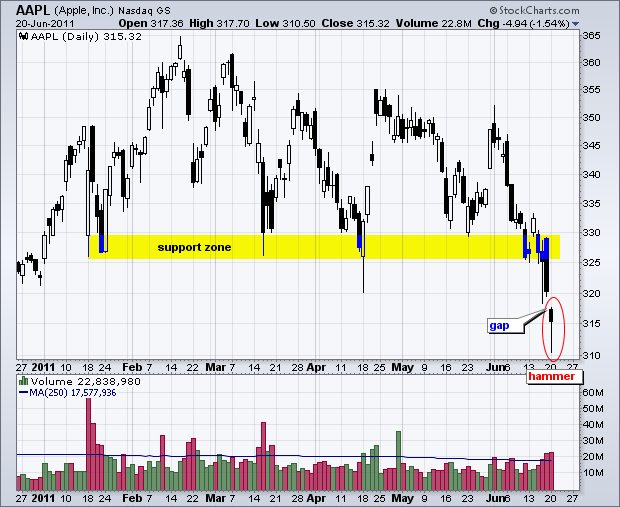
After breaking support with rather high volume the last three days, Apple (AAPL) formed a hammer candlestick that dipped below 315 intraday. The stock still has a gap to contend with and needs to fill this gap to confirm the hammer... Read More
Don't Ignore This Chart! June 17, 2011 at 02:49 PM
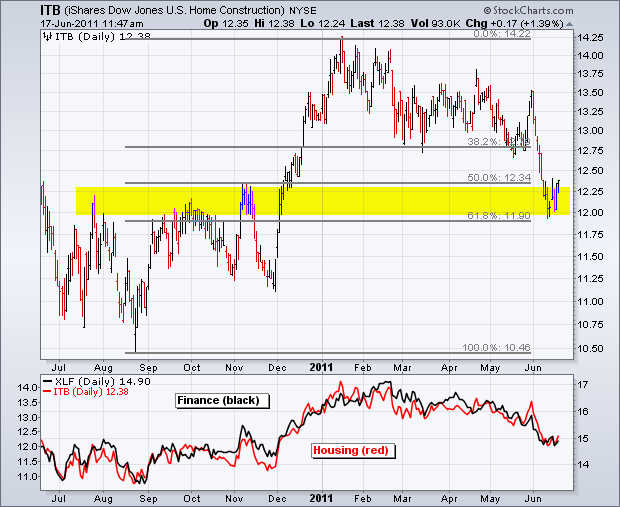
The Home Construction iShares (ITB) and the Finance SPDR (XLF) have been moving together the entire year. The indicator window shows XLF in black and ITB in red. Not much difference between these two price patterns... Read More
Don't Ignore This Chart! June 16, 2011 at 05:50 PM
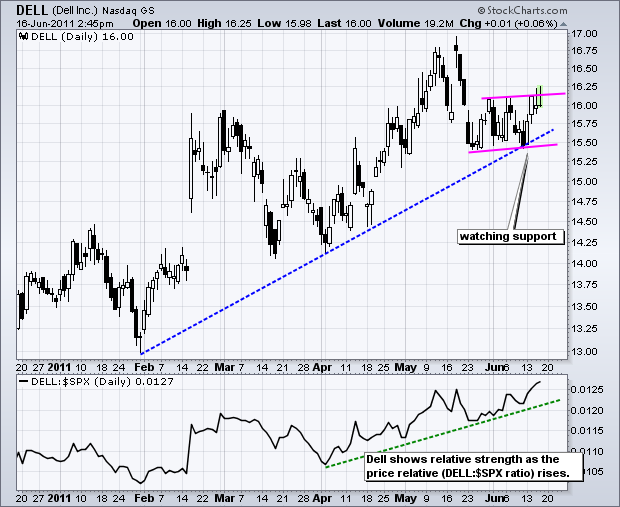
While the stock market swooned over the last few weeks, Dell Inc (DELL) held its ground and did not break its late May lows. In fact, the stock has been edging higher the last three weeks. The indicator window shows the Price Relative rising to a new high for 2011... Read More
Don't Ignore This Chart! June 15, 2011 at 05:19 PM
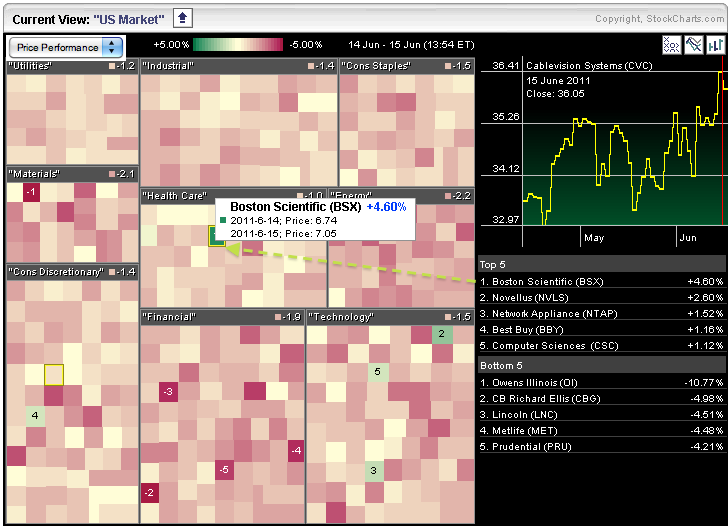
Stocks were down rather sharply on Wednesday, but a few were bucking the trend with gains. These can be found by looking for a little green in the Sector Market Carpet. Boston Scientific (BSX), Novellus (NVLS) and Network Appliance (NTAP) are attracting buyers on a big down day... Read More
Don't Ignore This Chart! June 14, 2011 at 06:09 PM
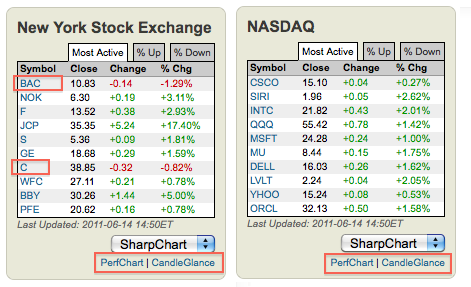
Stocks finally caught a bid with the Nasdaq leading the way higher. The image below comes from the Free Charts Page. All Nasdaq most actives are up. 8 of 10 NYSE most actives are up with Citigroup and Bank of America as the only decliners... Read More
Don't Ignore This Chart! June 13, 2011 at 06:00 PM
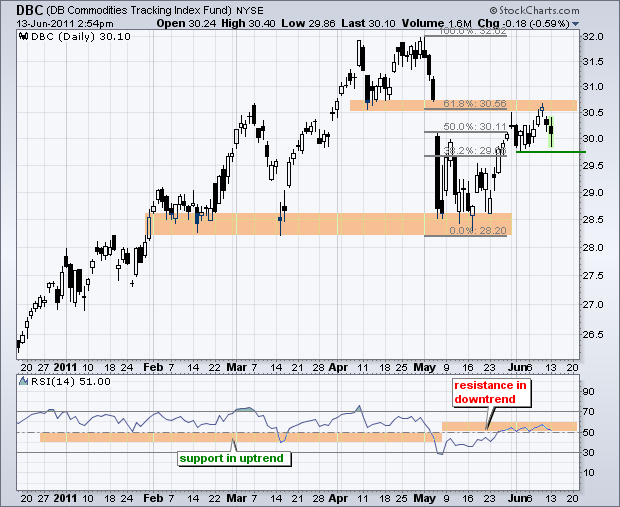
The Commodity Index Fund ($DBC) surged back above 30 in June, but is near resistance from broken support and the 62% retracement mark. Also notice that RSI is trading in its resistance zone (50-60) after becoming overbought. This is a make-or-break area for DBC... Read More
Don't Ignore This Chart! June 10, 2011 at 03:07 PM
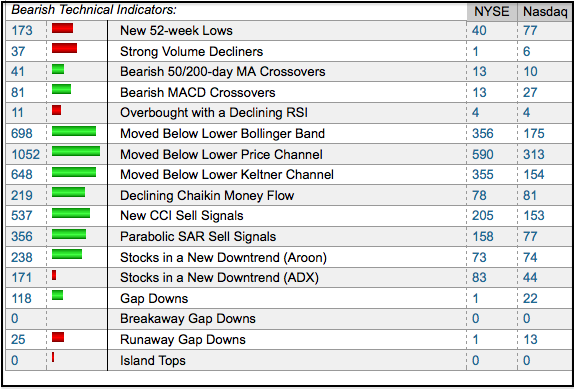
The Predefined Scans page features color coded bars so users can see when scans are active. Red bars show a decrease in hits. Green bars show an increase in hits. Today's intraday scan shows a sharp increase in the number of stocks making the cut in bearish scans... Read More
Don't Ignore This Chart! June 08, 2011 at 08:02 PM
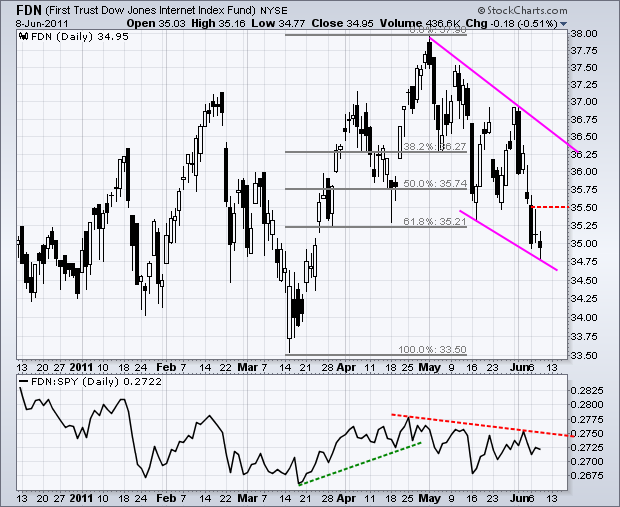
The FirstTrust Internet ETF (FDN) has been moving lower with the rest of the market, but firmed the last two days. A doji formed on Tuesday and a small spinning top on Wednesday. This firmness is also occurring near the 62% retracement mark and the ETF is short-term oversold... Read More
Don't Ignore This Chart! June 07, 2011 at 06:50 PM
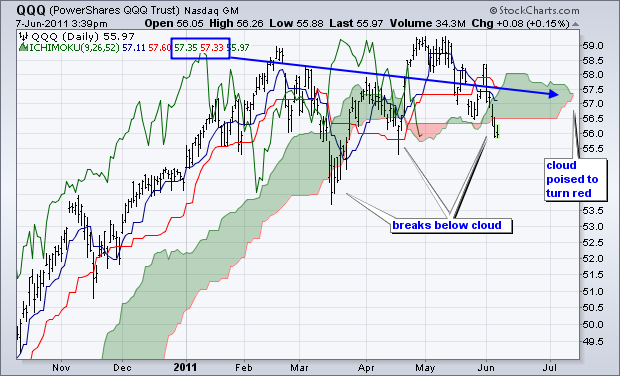
With the decline over the last several weeks, the Nasdaq 100 ETF (QQQ) broke below the Ichimoku Cloud for the third time since March. The ETF recovered quickly after the first two breaks... Read More
Don't Ignore This Chart! June 03, 2011 at 08:09 PM
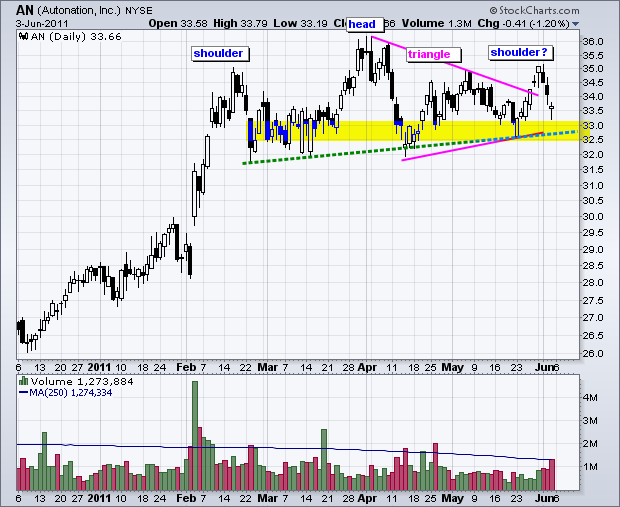
Auto Nation (AN) is tracing out a clear Head-and-Shoulders pattern, but remains short of a confirming support break. The most recent signal was a triangle breakout last week. AN has since moved back into triangle support. A move below 32... Read More
Don't Ignore This Chart! June 02, 2011 at 08:56 AM
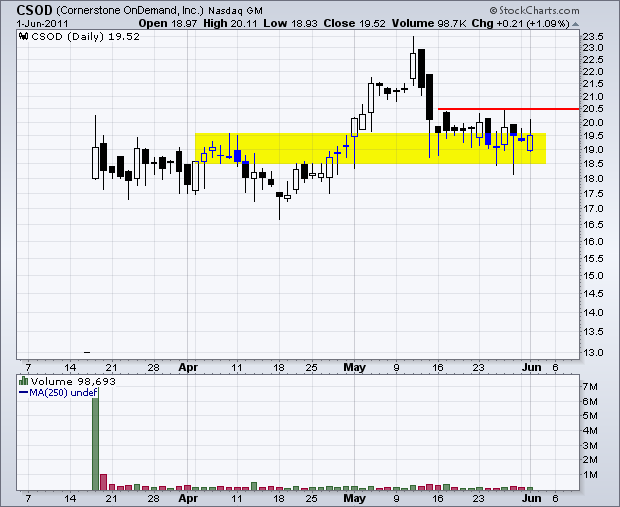
Despite yesterday's sharp decline, a number of stocks bucked the selling pressure by gaining on the day or forming bullish candlestick patterns. Cornerstone OnDemand ($CSOD), which debuted on March 17th, formed a bullish engulfing and gained on Wednesday... Read More
Don't Ignore This Chart! June 01, 2011 at 08:11 PM
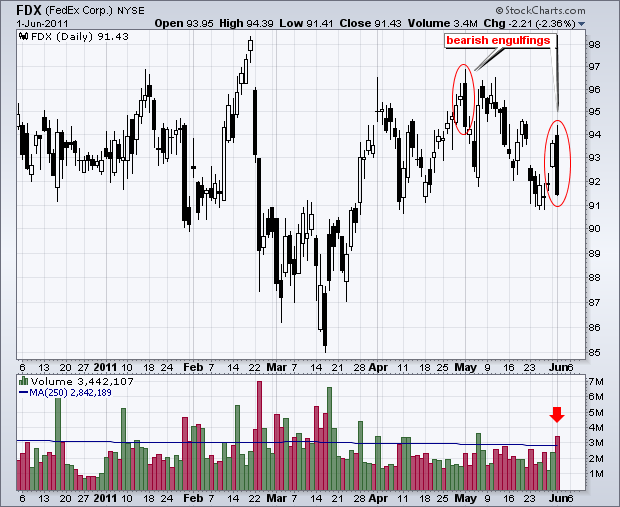
There are over 200 stocks across the various exchanges on Wednesday's bearish engulfing scan. From the NYSE, FedEx (FDX) formed a bearish engulfing on the first day of the month in both May and June. Wednesday's big bearish engulfing occurred on expanding volume... Read More