Don't Ignore This Chart! July 29, 2011 at 09:14 AM
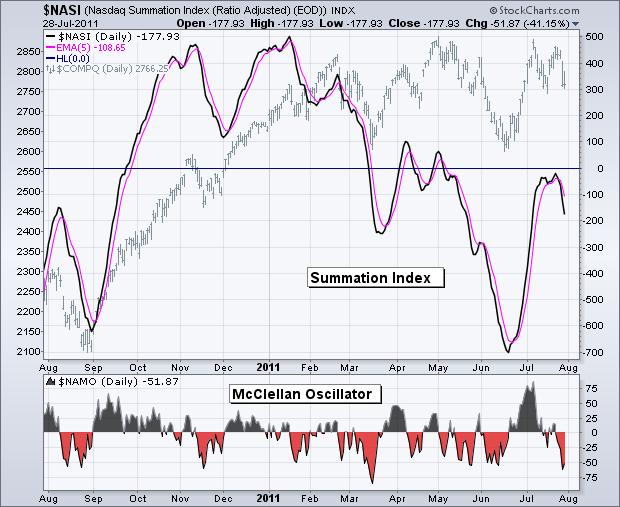
With another bout of selling pressure this week, the Nasdaq McClellan Summation Index reversed at the zero line and moved back below -100. Notice that this breadth indicator has been largely negative since mid March... Read More
Don't Ignore This Chart! July 28, 2011 at 06:27 PM
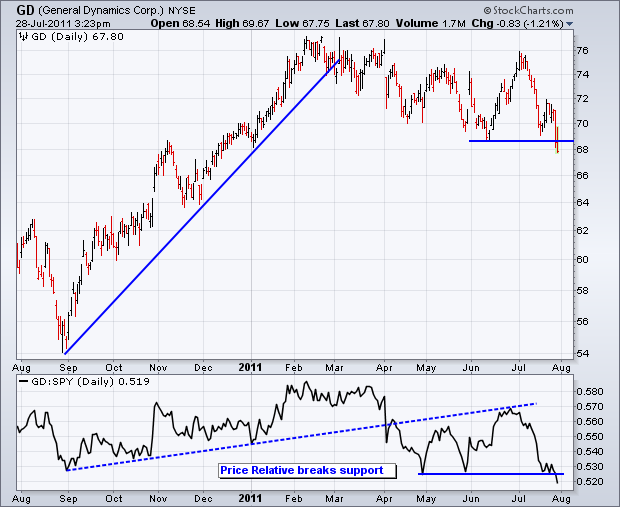
General Dynamics (GD) broke below its June low with a sharp decline the last two days. Also notice that the Price Relative (GD:SPY Ratio) broke support. GD is showing both absolute and relative weakness... Read More
Don't Ignore This Chart! July 27, 2011 at 09:00 PM
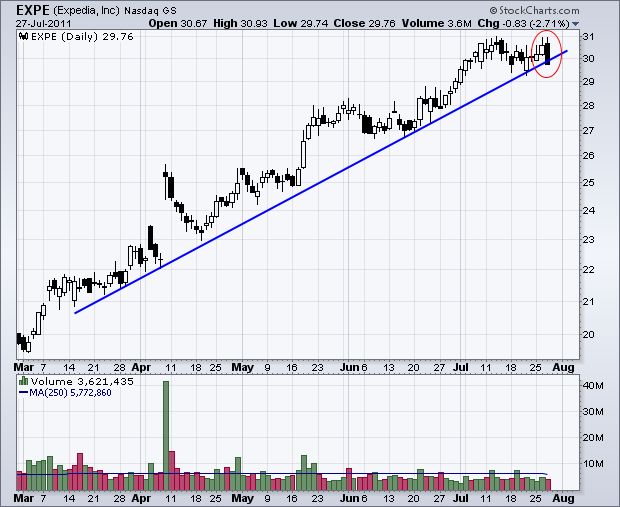
Expedia has been on a tear the last few months with 50+ percent advance since February. The stock has yet to correct, but a bearish engulfing pattern hints at a possible short-term reversal. More candlestick patterns can be found on the pre-defined scans page... Read More
Don't Ignore This Chart! July 26, 2011 at 07:39 PM
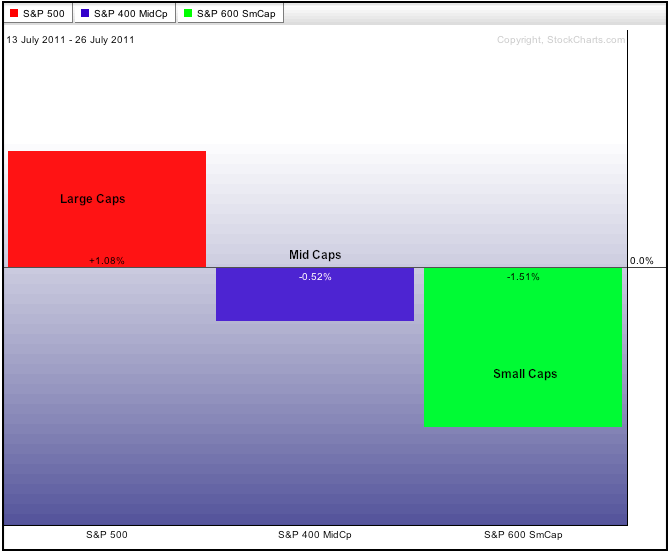
While the Nasdaq 100 continues to move higher and the S&P 500 shows gains the last 10 days, the PerfChart below shows that small and mid caps are starting to suffer. The S&P 500 is up just over 1% snce July 13th, but the S&P MidCap 400 and S&P SmallCap 600 are down... Read More
Don't Ignore This Chart! July 25, 2011 at 07:29 PM
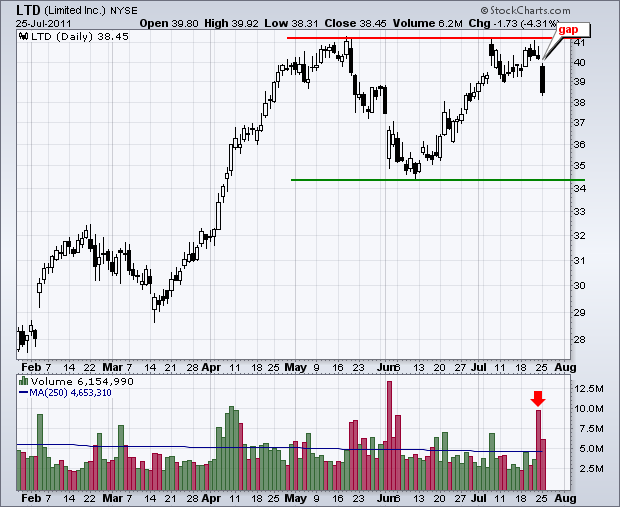
After meeting resistance from the May high twice this month, Limited (LTD) gapped down on big volume Monday. This gap should be considered bearish until proven otherwise with a move back above the gap zone... Read More
Don't Ignore This Chart! July 22, 2011 at 04:55 PM
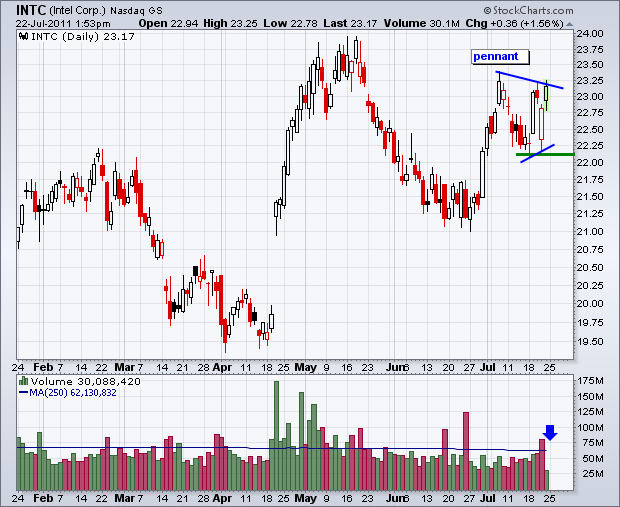
Intel (INTC) is making waves today with an attempt to break pennant resistance. Notice how the stock surged from 21 to 23.25 and then consolidated the last few weeks. A breakout would signal a continuation higher, but low volume detracts from today's move... Read More
Don't Ignore This Chart! July 21, 2011 at 05:33 PM
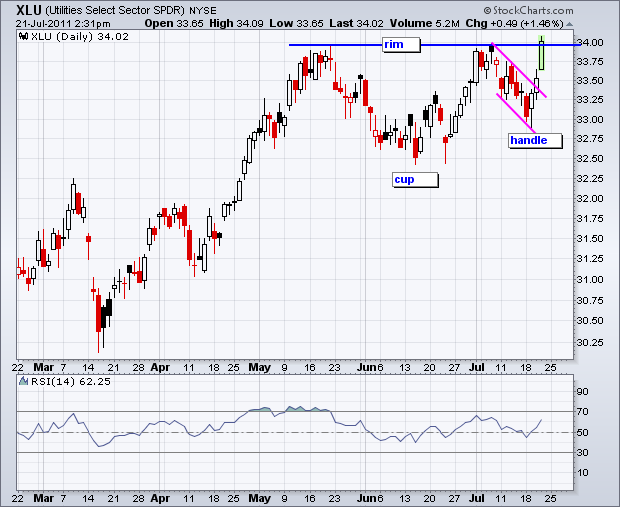
With a big surge over the last three days, the Utilities SPDR (XLU) is breaking rim resistance from a cup-with-handle pattern. These bullish continuation patterns were popularized by William O'Neal, founder of Daily Graphs and IBD... Read More
Don't Ignore This Chart! July 20, 2011 at 02:00 PM
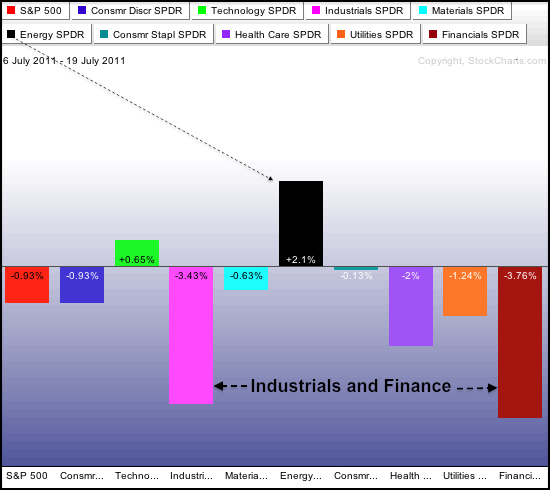
As this sector PerfChart shows, the Energy SPDR (XLE) is the standout performer over the last 10 trading days with a 2.1% gain. In contrast, the S&P 500 is down around 1% during this timeframe... Read More
Don't Ignore This Chart! July 19, 2011 at 05:22 PM
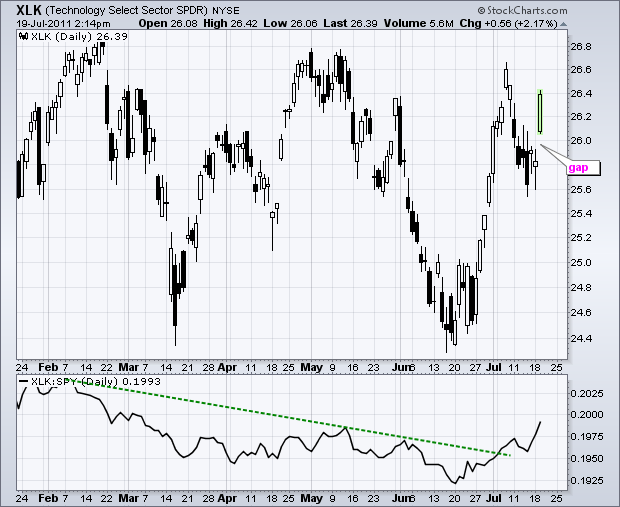
After firming for a few days, the Technology ETF (XLK) gapped higher on Wednesday with an open above 26. This is a big gap that is bullish as long as it holds. In the indicator window, the Price Relative turned up as XLK starts to outperform the S&P 500 ETF (SPY)... Read More
Don't Ignore This Chart! July 18, 2011 at 03:16 PM
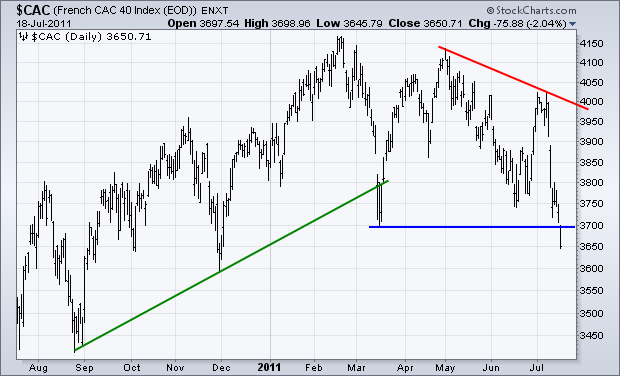
With a plunge over the last seven days, the French CAC Index ($CAC) broke below its March low and reached its lowest point of the year. Also notice that the index formed lower highs in May and early July. The breakdown reflects the current debt problems in the Euro zone... Read More
Don't Ignore This Chart! July 15, 2011 at 12:53 PM
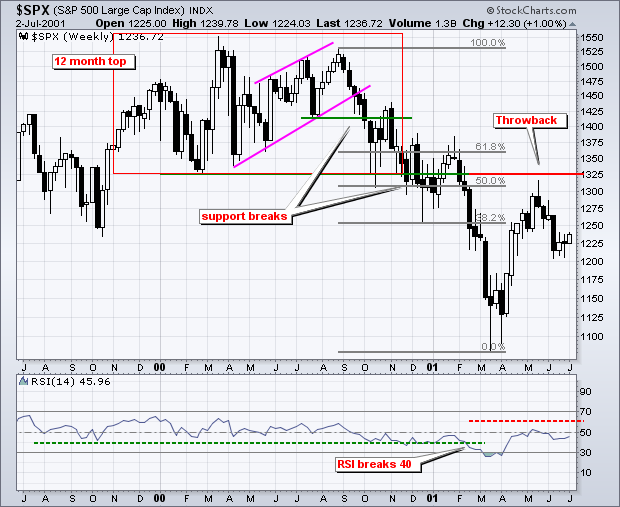
The 2000 market top evolved over a 12 month period as the S&P 500 traded between 1325 and 1550. The index broke this range at the end of 2000 and continued lower in early 2001... Read More
Don't Ignore This Chart! July 14, 2011 at 09:10 AM
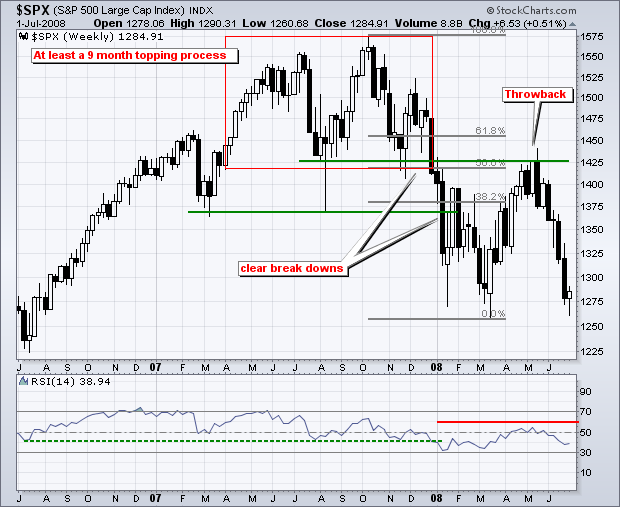
Although no two market tops are the same, we can get an idea of what a major reversal looks like by examining past reversals. The 2007 top evolved over a 9 month period. There were clear support breaks at 1425 and 1375... Read More
Don't Ignore This Chart! July 13, 2011 at 12:09 PM
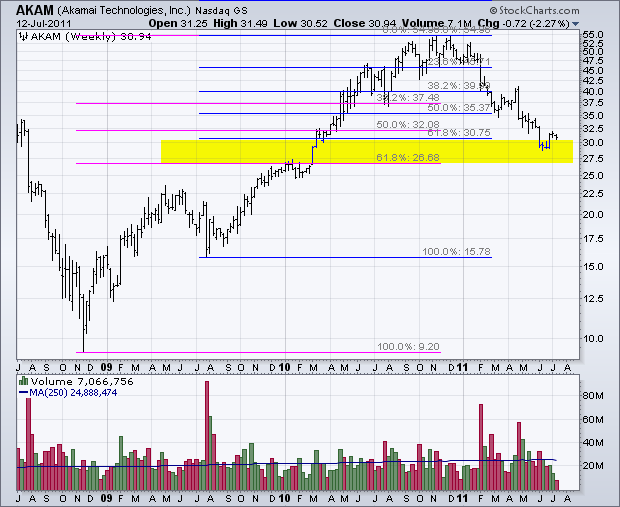
The Fibonacci Retracements Tool can be used to identify Fibonacci levels to estimate support, resistance or turning points. When there is more than one advance, chartists can apply this tool to both moves and look for a cluster zone... Read More
Don't Ignore This Chart! July 12, 2011 at 04:11 PM
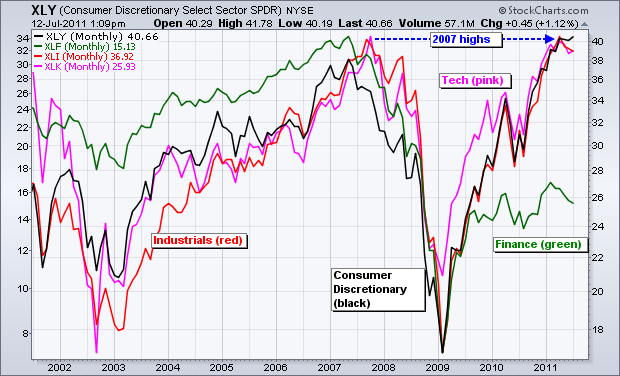
The advance since the March lows has been enough to power the Consumer Discretionary SPDR (XLY) past its 2007 high. The Industrials SPDR (XLI) and the Technology ETF (XLK) both met resistance at their 2007 highs over the last few months... Read More
Don't Ignore This Chart! July 11, 2011 at 01:24 PM
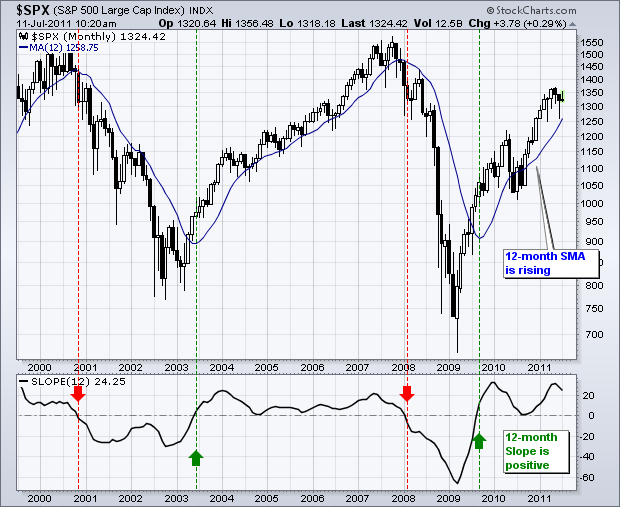
Taking a big step back to look at the big picture, the 12-month Slope indicator for the S&P 500 turned positive in September 2009 and remains positive. While this indicator does not pick exact tops or bottoms, it gives us a good idea of the long-term trend... Read More
Don't Ignore This Chart! July 08, 2011 at 03:32 PM
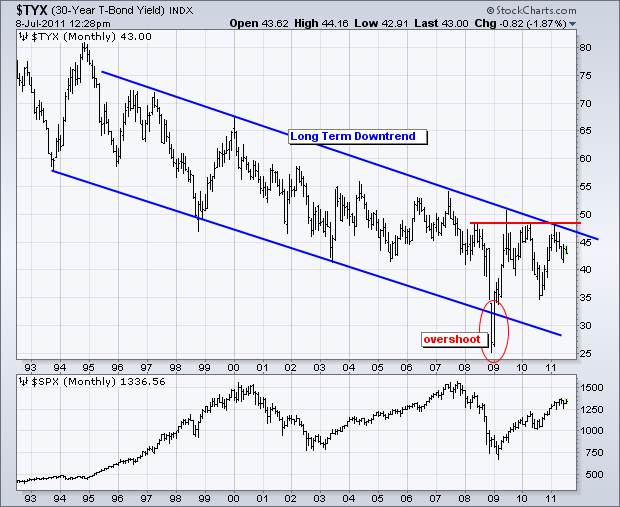
The 10-year Treasury Yield ($TNX) remains in a long-term downtrend that is dominated by a falling channel. The upper trendline has been touched at least four times since the mid 90s. More recently, the 10-year Treasury Yield hit resistance around 48... Read More
Don't Ignore This Chart! July 07, 2011 at 04:40 PM
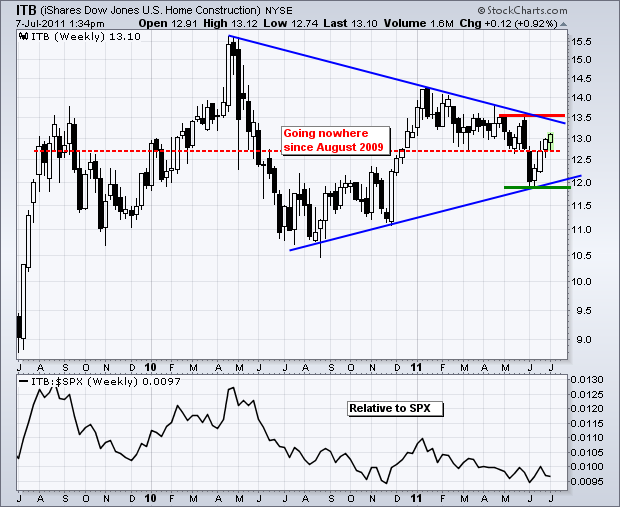
The Home Construction iShares (ITB) has gone nowhere since August 2009. After first crossing back above 12.75 in early August 2009, the ETF has meandered above/below this level the last 23 months. On the right half of the range, a large Symmetrical Triangle is taking shape... Read More
Don't Ignore This Chart! July 06, 2011 at 12:31 PM
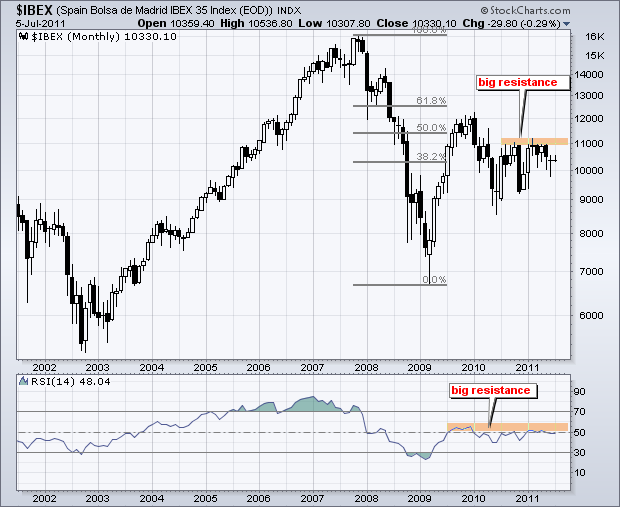
The Spain Bolsa de Madrid IBEX 35 Index ($IBEX) hit a major resistance zone around 11000. Notice that the index has been turned back near this level since July 2010 (one year). A breakout is needed to revive the bulls here and build confidence in Europe... Read More
Don't Ignore This Chart! July 05, 2011 at 05:27 PM
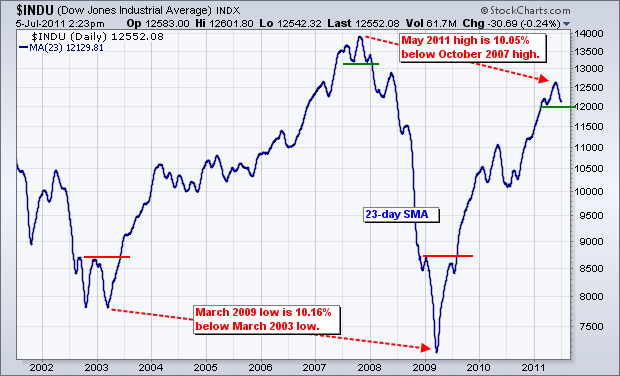
The chart below shows the 23-day SMA for the Dow Industrials. There are around 23 trading days per month and this represents a rolling monthly average. It also smooths daily volatility... Read More
Don't Ignore This Chart! July 01, 2011 at 06:27 AM
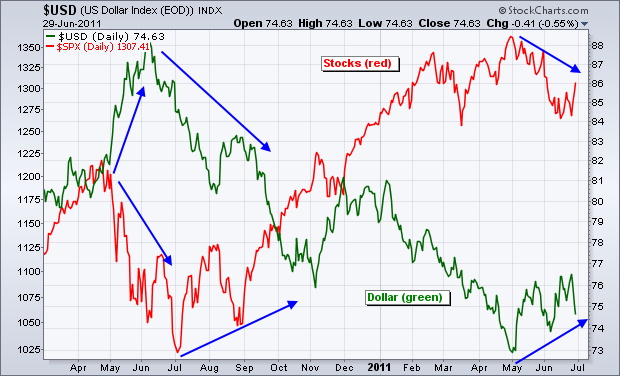
The Dollar and the S&P 500 have been negatively correlated since April 2010. The chart below shows three big swings with the Dollar and S&P 500 moving in opposite directions... Read More