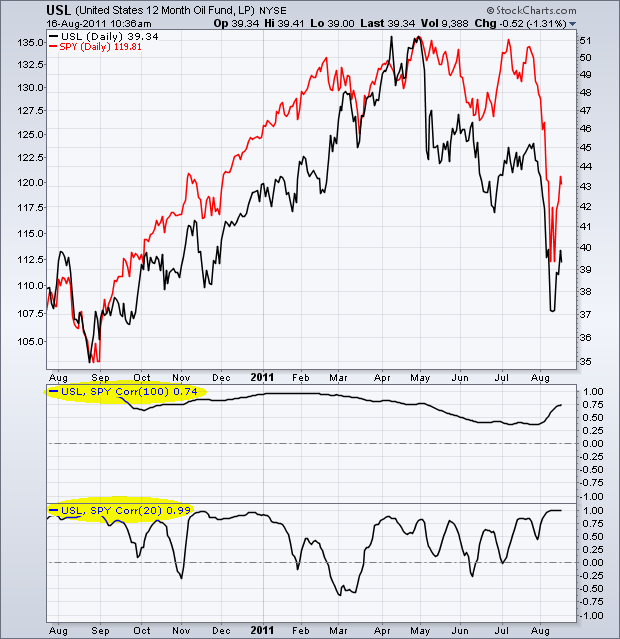
The Correlation Coefficient is used to measure the degree of correlation between two assets. Positive correlation means they move in the same direction. Negative correlation means they move in opposite directions. The 12-Month US Oil Fund (USL) and S&P 500 ETF (SPY) are positively correlated. The 20-day Correlation Coefficient shows a few dips into negative territory, but remained largely positive. The 100-day Correlation Coefficient never came close to negative territory.

Click this image for a live chart

About the author:
Arthur Hill, CMT, is the Chief Technical Strategist at TrendInvestorPro.com. Focusing predominantly on US equities and ETFs, his systematic approach of identifying trend, finding signals within the trend, and setting key price levels has made him an esteemed market technician. Arthur has written articles for numerous financial publications including Barrons and Stocks & Commodities Magazine. In addition to his Chartered Market Technician (CMT) designation, he holds an MBA from the Cass Business School at City University in London.
Learn More