Don't Ignore This Chart! September 30, 2011 at 09:50 AM
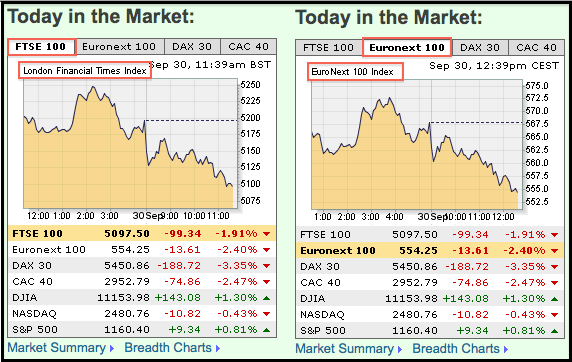
The London FTSE 100 ($FTSE) and the EuroNext 100 ($N100) moved sharply lower on Friday. These two indices are easy to track from the StockCharts.com home page. The chart below comes from the home page... Read More
Don't Ignore This Chart! September 29, 2011 at 08:08 PM
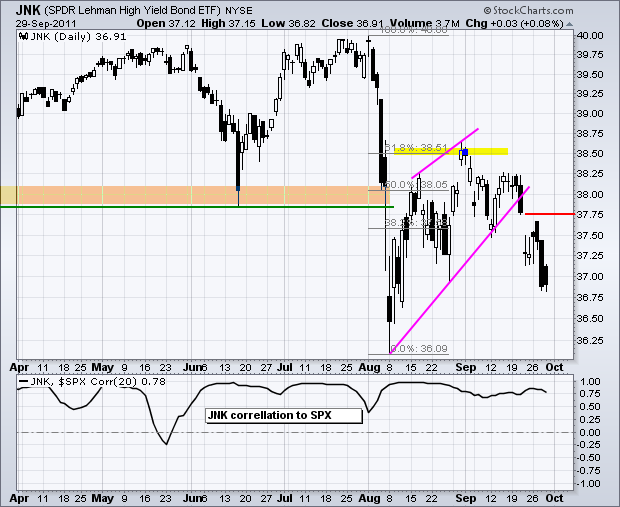
The High-Yield Bond SPDR (JNK) has a strong positive correlation to the stock market. Notice that the Correlation Coefficient is consistently above the .50 level. This means that the Junk Bond ETF and the S&P 500 move in the same direction most of the time... Read More
Don't Ignore This Chart! September 28, 2011 at 07:55 PM
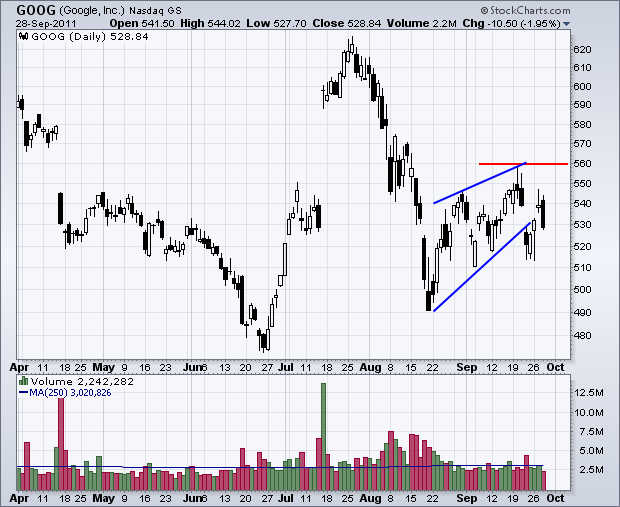
With a strong open and weak close on Wednesday, hundres of stocks made the cut for the bearish engulfing scan (177 Nasdaq and 183 NYSE). The chart below shows Google ($GOOG) breaking wedge support last week and forming a bearish engulfing after a three day bounce... Read More
Don't Ignore This Chart! September 27, 2011 at 02:00 PM
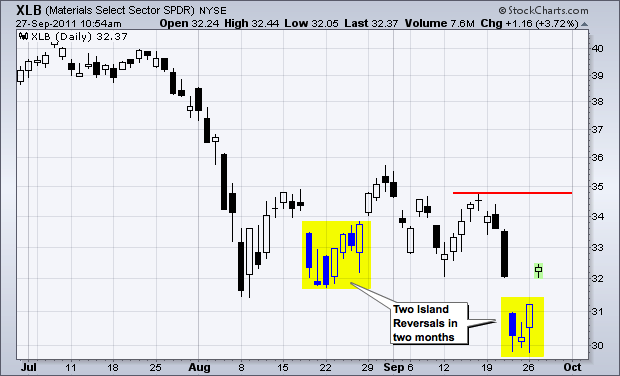
Recent volatility is making rare patterns not so rare. The chart below shows the Basic Materials SPDR (XLB) with its second Island Reversal in as many months. The most recent pattern formed with a gap down on Thursday, a consolidation Friday-Monday and a big gap up today... Read More
Don't Ignore This Chart! September 26, 2011 at 05:39 PM
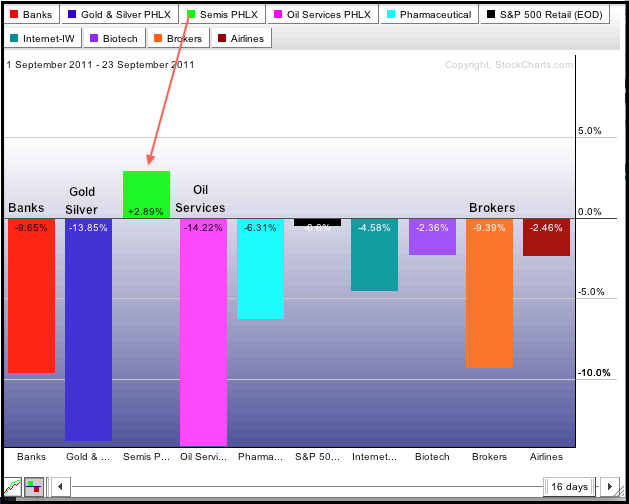
September has not been nice for the broader market, but one key industry group is holding up quite well. The Semiconductor Index ($SOX) actually shows a gain month-to-date and shows relative strength... Read More
Don't Ignore This Chart! September 23, 2011 at 11:09 AM
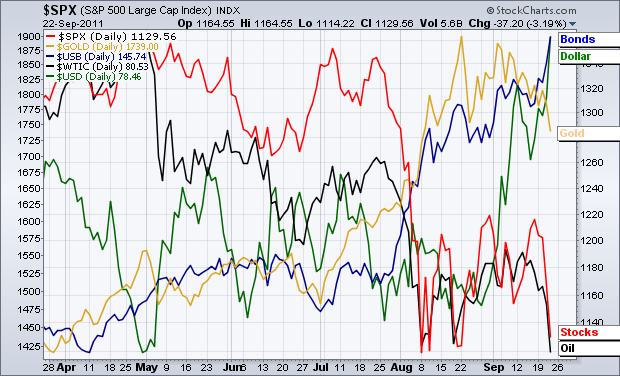
The chart below shows the five key intermarket securities with each ranked on the right side of the chart. The US Dollar Index ($USD) and 30-Year US Treasury ($USB) are at the top (strongest), while the S&P 500 and Spot Light Crude ($WTIC) are at the bottom (weakest)... Read More
Don't Ignore This Chart! September 22, 2011 at 08:46 PM
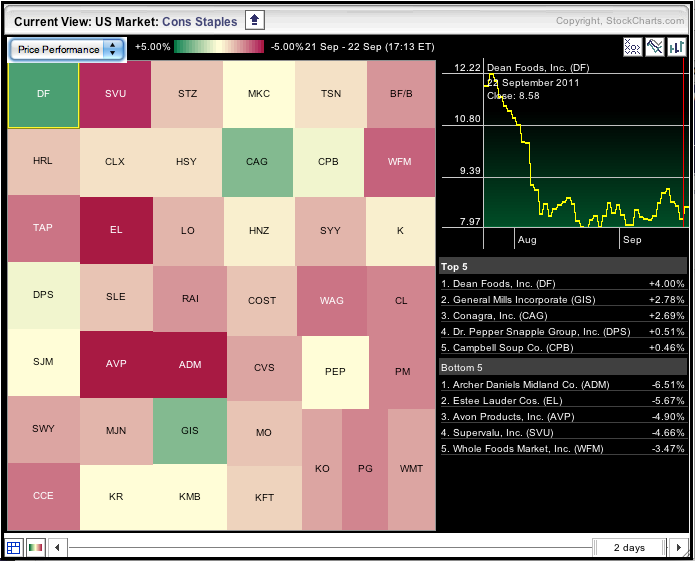
Stocks were down sharply on Thursday with all sectors moving lower on the day. There were, however, a few select pockets of strength. These can be found by looking for shades of green in the market carpet. The image below shows the Consumer Staples sectors with a few gainers... Read More
Don't Ignore This Chart! September 21, 2011 at 05:19 PM
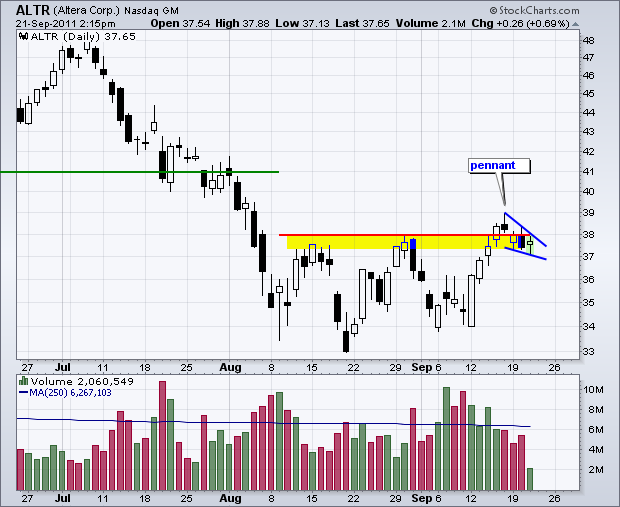
Altera (ALTR) is at its make-or-break point. The stock surged to the August highs with a rather strong move last week. This advance met resistance as the stock pulled back with a pennant last four days... Read More
Don't Ignore This Chart! September 20, 2011 at 08:09 PM
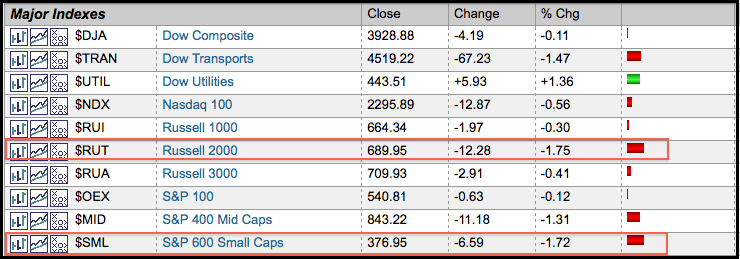
Stocks sold off in the final hour with small-caps leading the way lower. As the market summary page shows, the S&P SmallCap 600 ($SML) and the Russell 2000 ($RUT) led the afternoon decline with losses greater than 1.5% on the day... Read More
Don't Ignore This Chart! September 19, 2011 at 06:48 PM
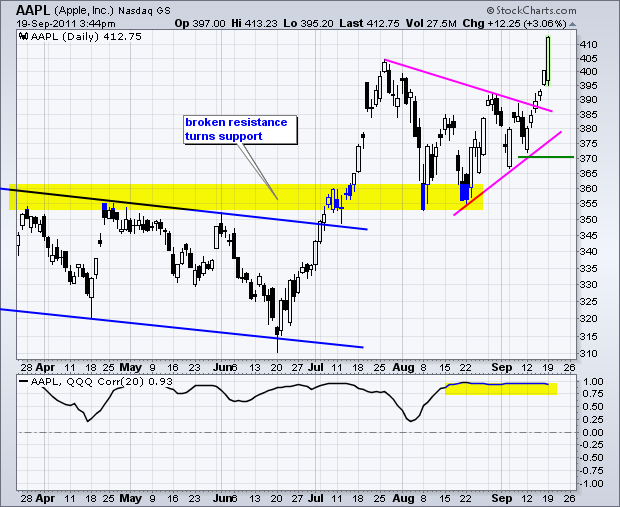
As Apple goes, so goes the Nasdaq 100 ETF (QQQ). Wall Street used to say the same thing about GM during its heyday. Apple surged to a new 52-week high and powered QQQ higher on Monday. The indicator window shows the Correlation Coefficient trading above .90 since mid August... Read More
Don't Ignore This Chart! September 16, 2011 at 02:49 PM
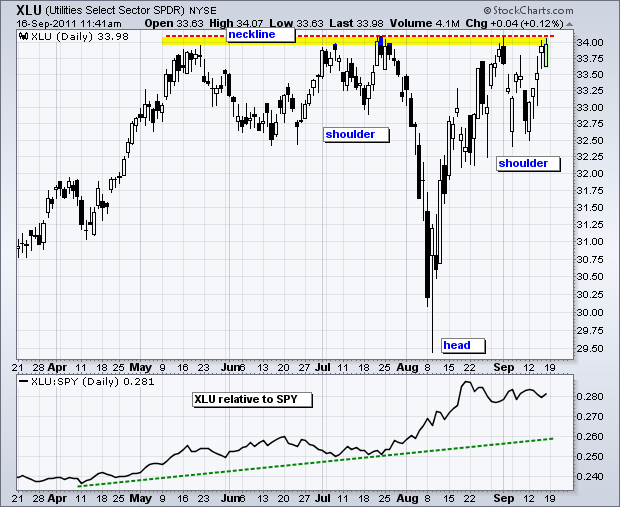
The Utilities SPDR (XLU) continues to hold up well as it challenges its May-August highs with an inverse Head-and-Shoulders pattern. This also happens to be a bullish continuation pattern. Yes, a Head-and-Shoulders can mark a continuation... Read More
Don't Ignore This Chart! September 15, 2011 at 02:02 PM
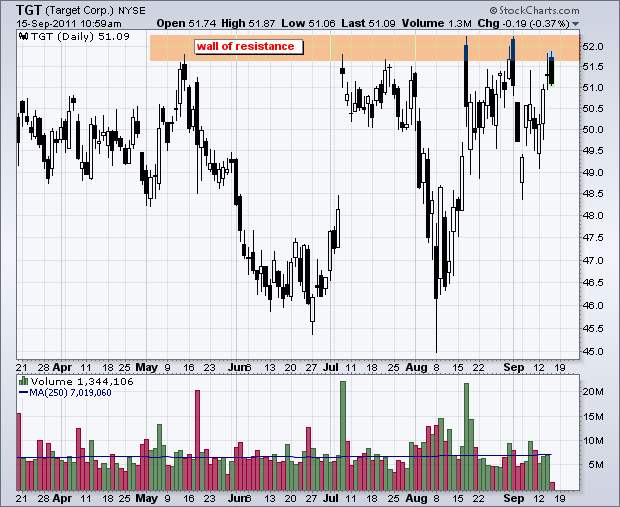
Target (TGT) surged to resistance in the 51.5-52 area for the third time in five weeks and formed a long black candlestick. A black (filled) candlestick means the close or current price is below the open. This means TGT opened at 51.74 on Thursday and moved lower after this open... Read More
Don't Ignore This Chart! September 14, 2011 at 07:37 PM
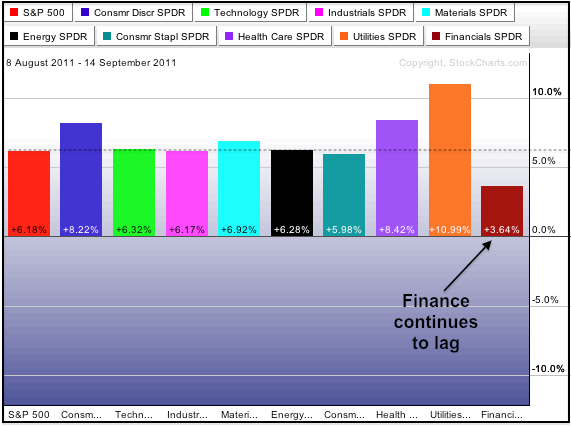
Stocks put together a pretty good rally over the last five weeks, but the finance sector continues to show relative weakness. The chart below shows the S&P Sector PerfChart with the percentage gain for the nine sectors and the S&P 500... Read More
Don't Ignore This Chart! September 13, 2011 at 06:46 PM
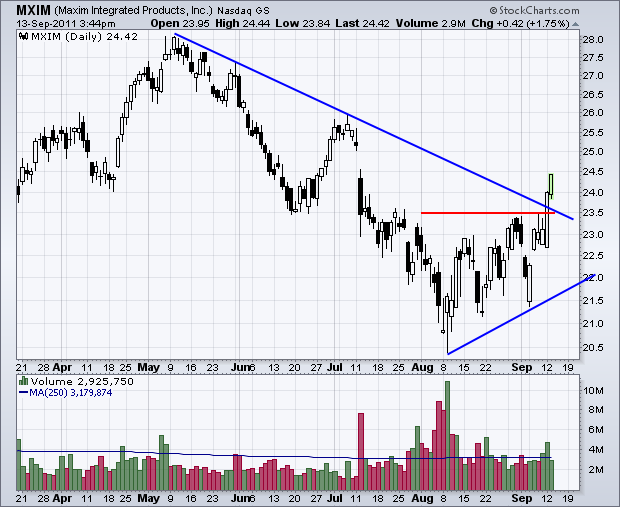
Maxim is leading a resurgent semiconductor group with a big surge over the last six days. The stock broke above its August high and exceeded the May trendline. Volume also picked up on the breakout... Read More
Don't Ignore This Chart! September 12, 2011 at 07:02 PM
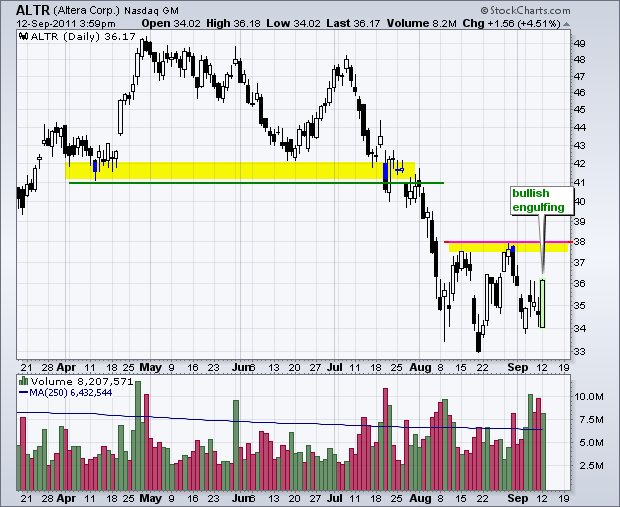
Semiconductor stocks showed some relative strength on Monday. Altera (ALTR) participated with a big bullish engulfing on high volume. This is the second high-volume advance in the last five trading days. Look for follow through above resistance at 38 for confirmation... Read More
Don't Ignore This Chart! September 09, 2011 at 03:22 PM
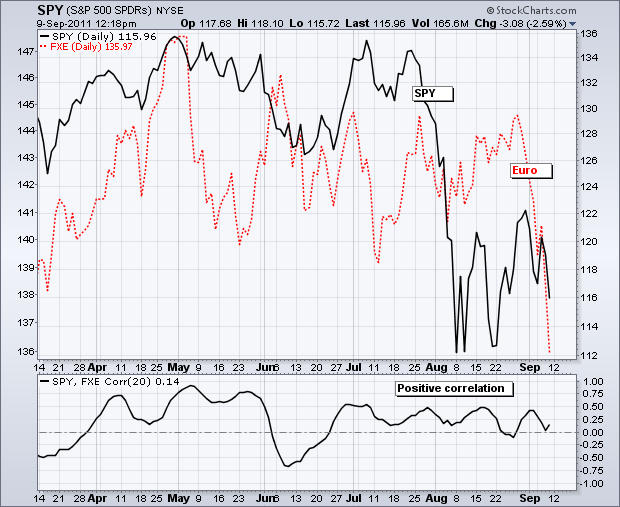
The S&P 500 ETF (SPY) and the Euro Currency Trust (FXE) moved sharply lower the last two weeks with the Euro leading the way. FXE is trading below its summer lows and SPY may be about to follow suit. The indicator window shows the SPY:FXE Correlation Coefficient... Read More
Don't Ignore This Chart! September 08, 2011 at 07:56 PM
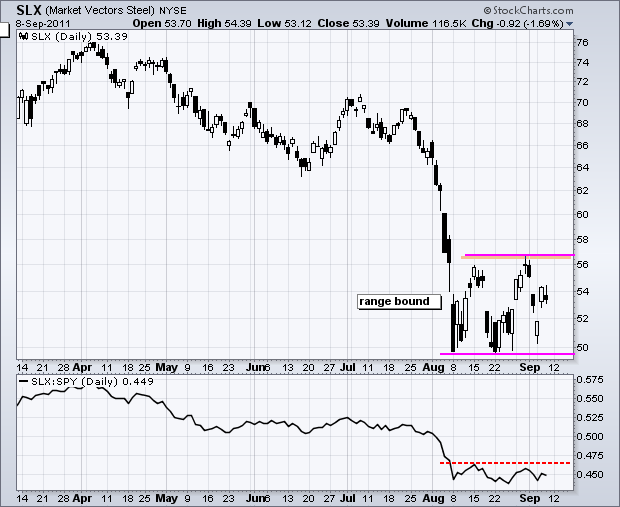
Like many other ETFs and stocks, the Steel ETF (SLX) has been range bound since the early August breakdown. The ETF plunged to 50 in early August and then moved into a trading range the last five weeks. Watch the range boundaries for the next directional clue... Read More
Don't Ignore This Chart! September 07, 2011 at 07:17 PM
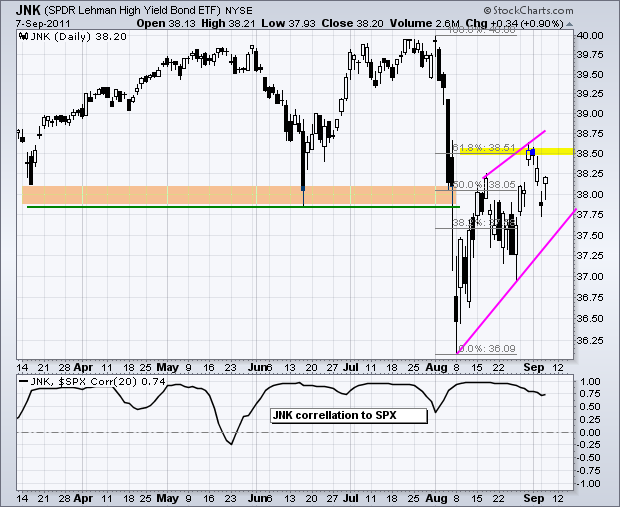
The High-Yield Bond SPDR (JNK) broke major support along with the S&P 500 in early August and then rebounded the last five weeks. This rebound formed a rising wedge and retraced 61.80% of the prior decline... Read More
Don't Ignore This Chart! September 06, 2011 at 06:05 PM
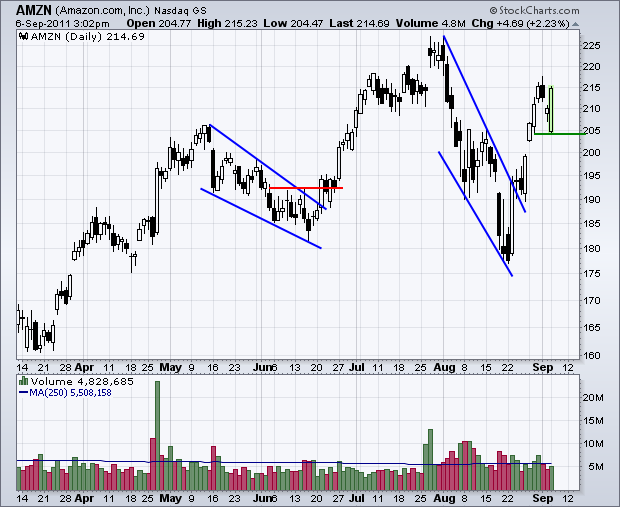
Stocks rebounded after a sharply lower open on Tuesday, but remain in negative territory overall. Amazon (AMZN) is bucking this trend with a 2+ percent gain. Gaining in the face of weakness shows relative strength... Read More
Don't Ignore This Chart! September 02, 2011 at 02:41 PM
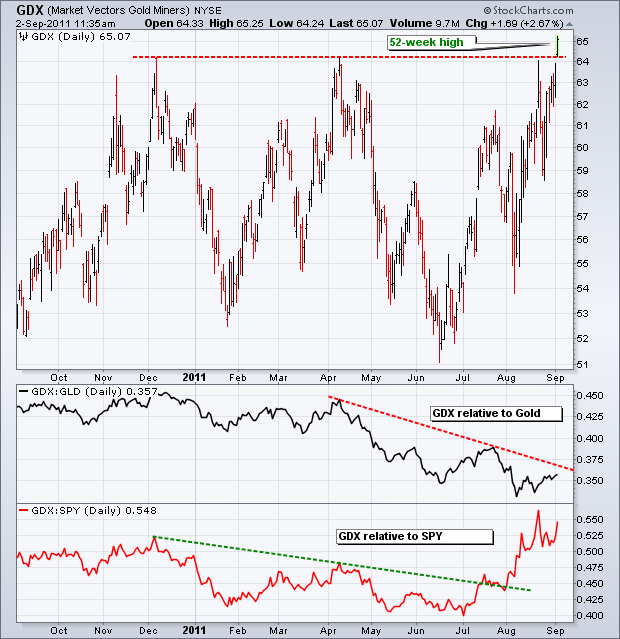
Even though the Gold Miners ETF (GDX) is underperforming gold, it is outperforming the stock market and hitting a fresh 52-week high. The GDX:GLD price relative remains in a downtrend, but the GDX:SPY price relative broke out in July to start an uptrend... Read More
Don't Ignore This Chart! September 01, 2011 at 12:04 PM
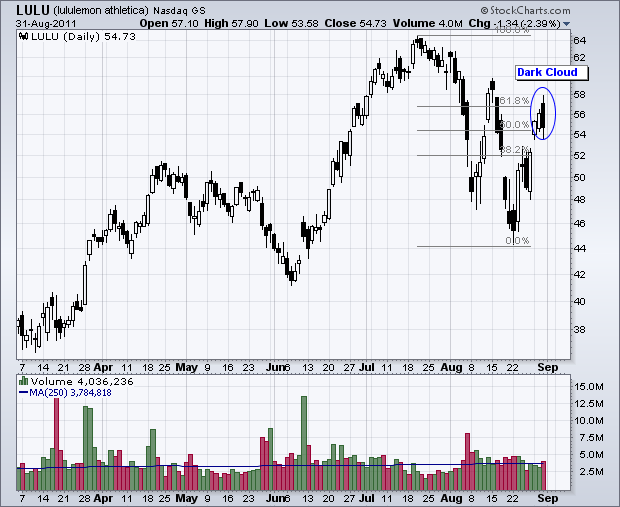
High flyer Lululemon (LULU) surged over 20% the last seven days, but hit a resistance zone around 57 with a Dark Cloud pattern. Notice that this area also marks a 61.80% retracement of the July-August decline. A move below the gap at 53 would confirm the Dark Cloud pattern... Read More