Don't Ignore This Chart! November 29, 2011 at 05:31 PM
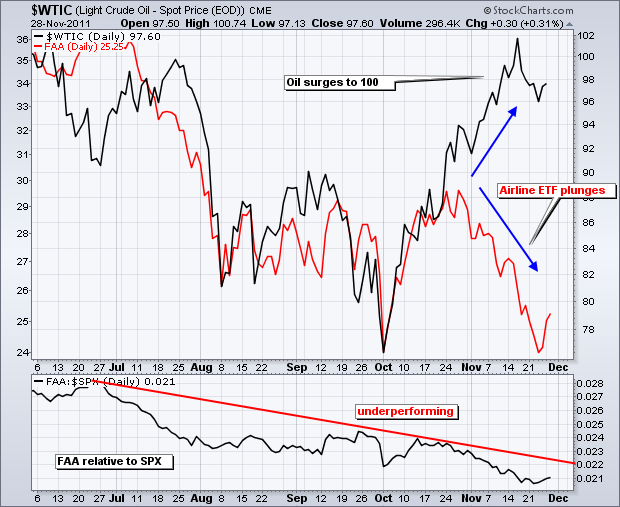
The Airline ETF (FAA) and Spot Light Crude ($WTIC) were moving in the same direction from July to mid October, but went their separate was in late October. Spot Light Crude surged above 100 in November as the Airline ETF tested its early October low... Read More
Don't Ignore This Chart! November 28, 2011 at 05:29 PM
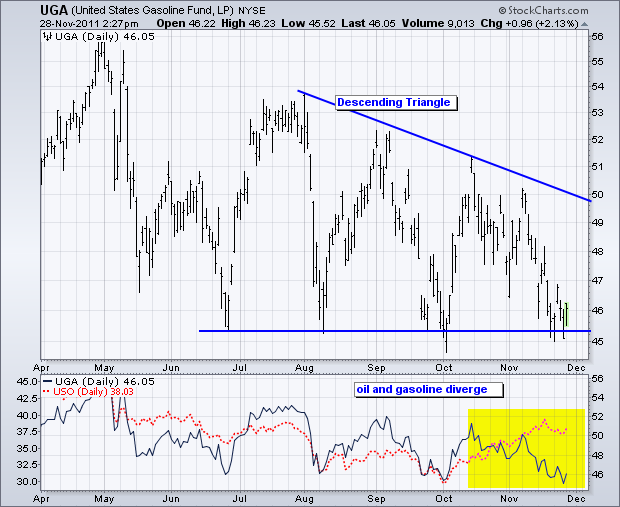
The indicator window shows the US Gasoline Fund (UGA) peaking in mid October (blue) and moving lower the last six weeks, while the US Oil Fund (USO) continued moving higher (red). Something needs to give here... Read More
Don't Ignore This Chart! November 25, 2011 at 01:07 PM
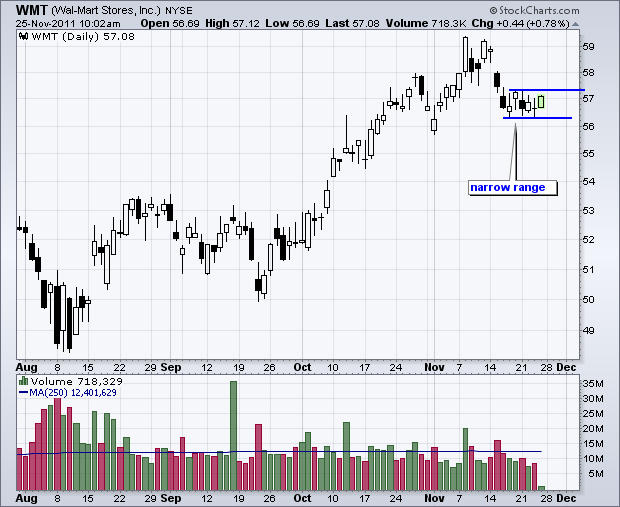
Wal-Mart (WMT) remains in an uptrend overall, but may be poised for a correction as Black Friday comes and goes. The stock declined sharply in mid November and then consolidated the last 6-7 days. Watch for a break from this consolidation to trigger the next signal... Read More
Don't Ignore This Chart! November 23, 2011 at 01:52 PM
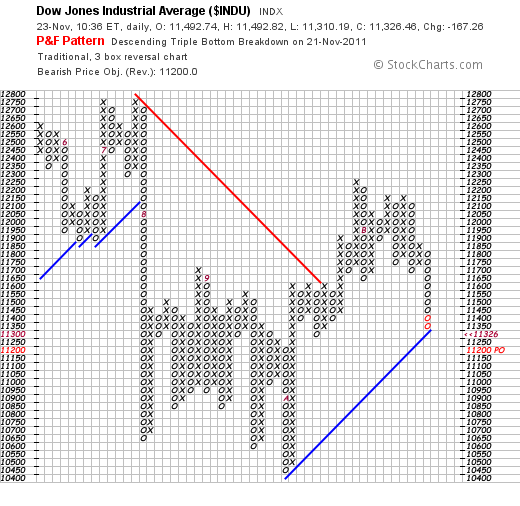
So, how significant is the Dow's recent loss? If you understand the power of P&F charting, you'll get your answer from this chart: For those that are new to P&F charts, remember that they automatically filter out insignificant price moves... Read More
Don't Ignore This Chart! November 23, 2011 at 09:44 AM
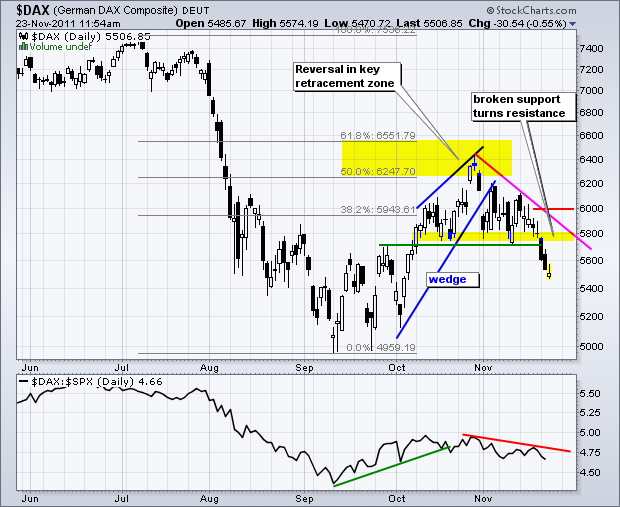
After forming a rising wedge in October, the German DAX reversed in the key retracement zone and broke support with a sharp decline below 5700 the last few days. These are clearly bearish developments... Read More
Don't Ignore This Chart! November 22, 2011 at 02:48 PM
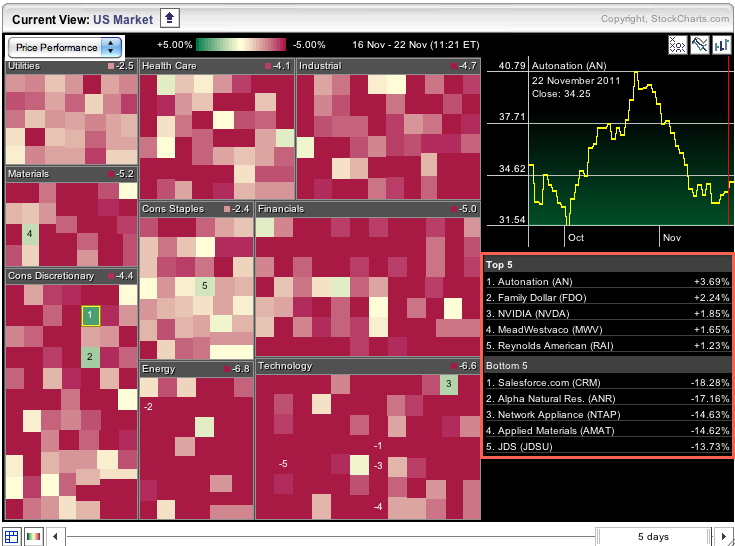
There have been few hiding places over the last five trading days. The major indices are down sharply and all sectors are also down... Read More
Don't Ignore This Chart! November 21, 2011 at 03:38 PM
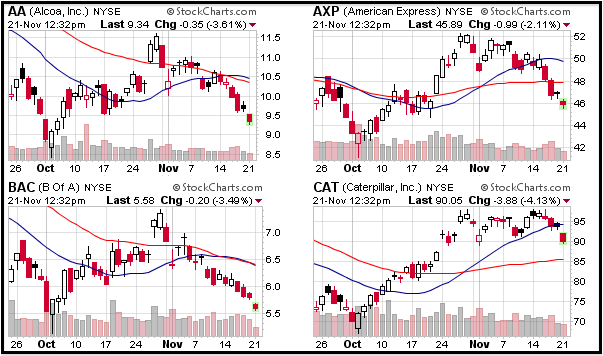
The CandleGlance chart for the 30 Dow stocks provides snapshot of the current day's action. As of 12:30ET on Monday, all 30 components were down with most down over 2%. This is clearly a broad-based decline that is affecting all sectors... Read More
Don't Ignore This Chart! November 18, 2011 at 02:44 PM
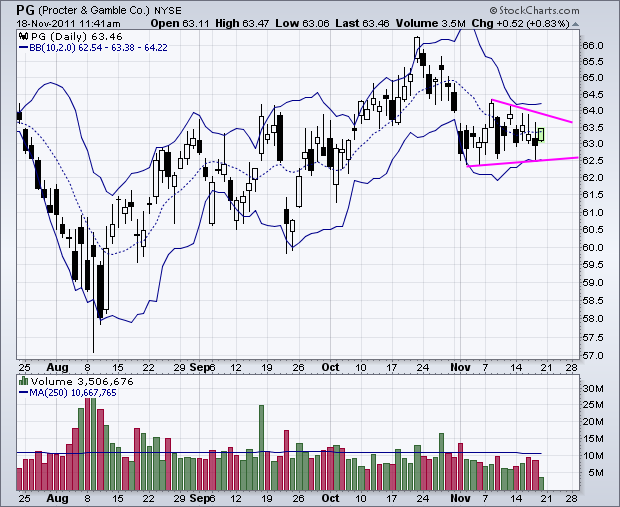
After a sharp decline and gap down, Procter & Gamble (PG) moved into a tight trading range the last three weeks. The pink lines show a pennant or small triangle taking shape. The blue lines show Bollinger Bands (10,2) narrowing as well... Read More
Don't Ignore This Chart! November 17, 2011 at 06:36 PM
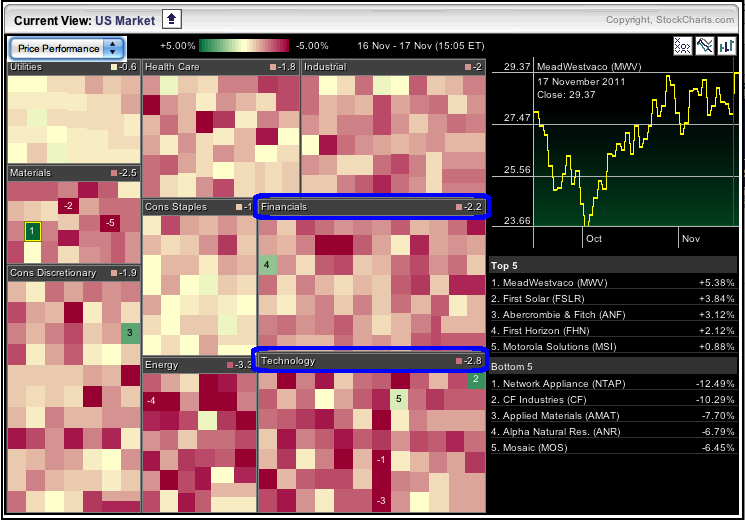
The Market Carpet is a sea of red on Thursday with the technology and finance sectors leading the way lower. Notice the numbers in the top box of each sector. The average tech stock is down 2.8% and the average finance stock is down 2.2% (just before the close)... Read More
Don't Ignore This Chart! November 16, 2011 at 06:33 PM
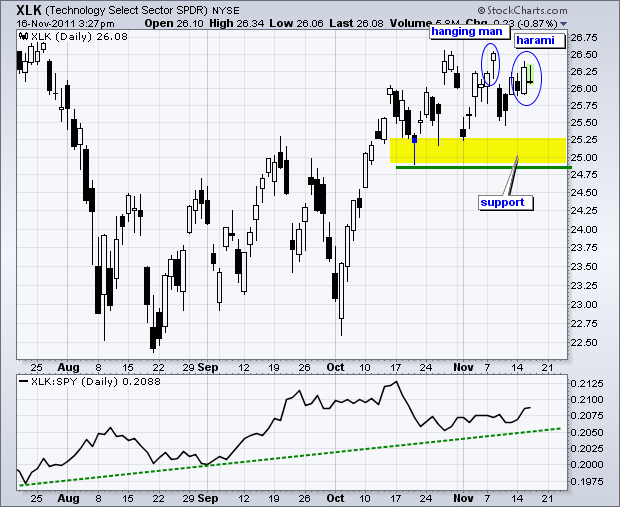
The Technology SPDR (XLK) is hitting resistance from the late October high with a Hanging Man last week and a Harami this week. Both candlesticks are bearish reversal patterns... Read More
Don't Ignore This Chart! November 15, 2011 at 02:36 PM
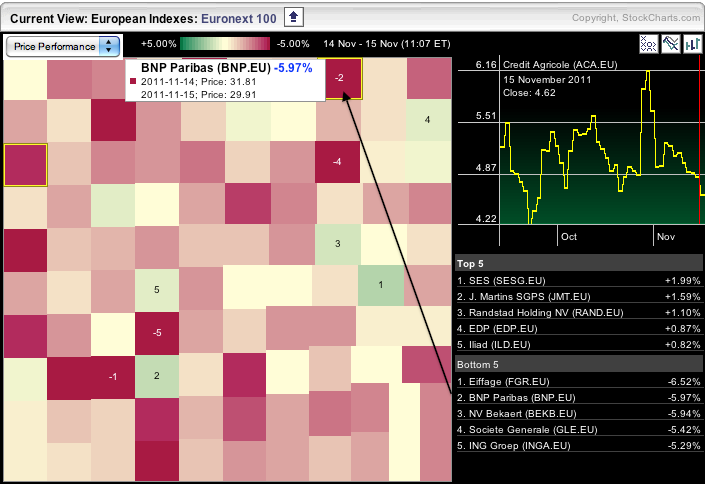
StockCharts.com offers a Market Carpet covering component stocks for seven European Indices. Chartists can look at all seven or click the title bar to focus on one. The image below focuses on the Euronext 100... Read More
Don't Ignore This Chart! November 14, 2011 at 06:14 PM
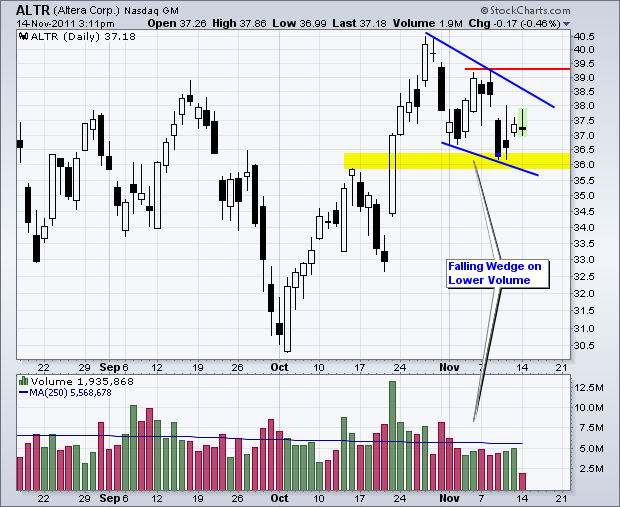
After a surge with good volume in October, Altera (ALTR) corrected with a falling wedge the last 2-3 weeks. Also notice that the stock exceeded its September high with the October surge... Read More
Don't Ignore This Chart! November 11, 2011 at 04:57 AM
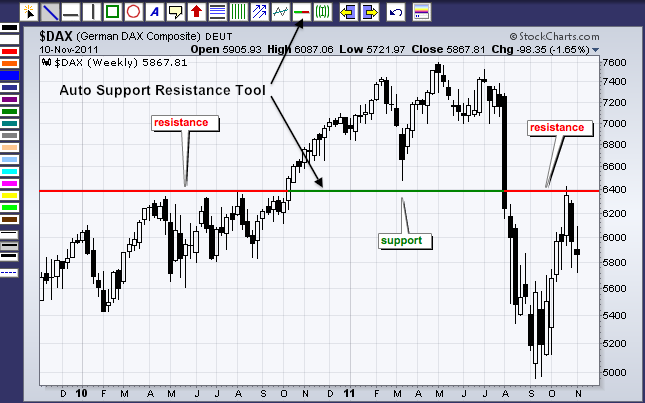
Traditional technical analysis teaches us that broken resistance turns support and broken support turns resistance. This concept is alive and well on the German DAX Index ($DAX) chart... Read More
Don't Ignore This Chart! November 10, 2011 at 02:02 PM
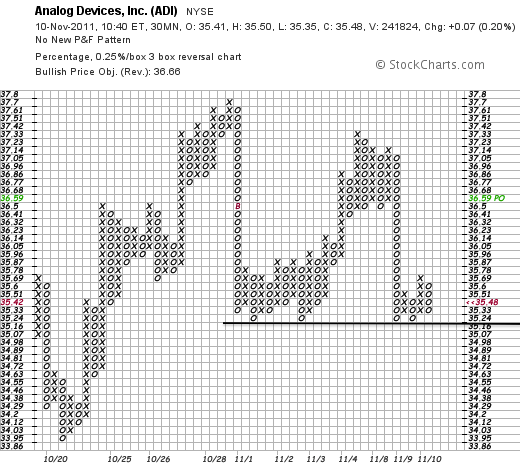
After plunging along with the market early this week, Analog Devices (ADI is trading at support from the early November lows. On this P&F chart, each box represents a quarter percent price change (.25%) and price data is based on the close every 30 minutes... Read More
Don't Ignore This Chart! November 09, 2011 at 08:26 PM
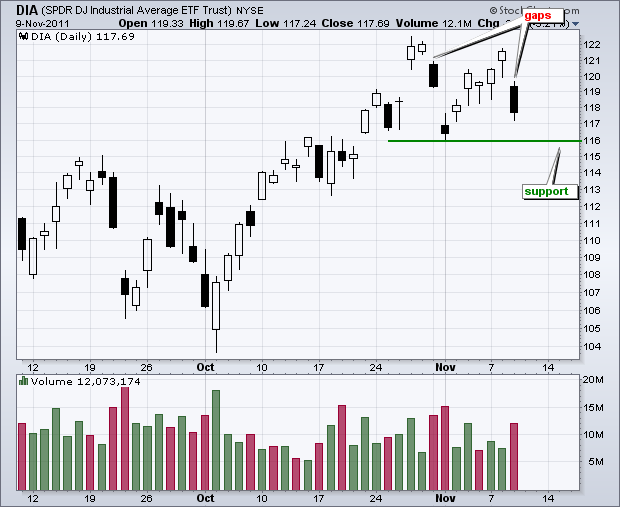
For the second time in three weeks, the Dow Industrials SPDR (DIA) moved above 121 and then gapped down. These two gaps indicate that DIA has stiff resistance in the 122 area. Key support is based on the prior trough at 116... Read More
Don't Ignore This Chart! November 08, 2011 at 07:39 PM
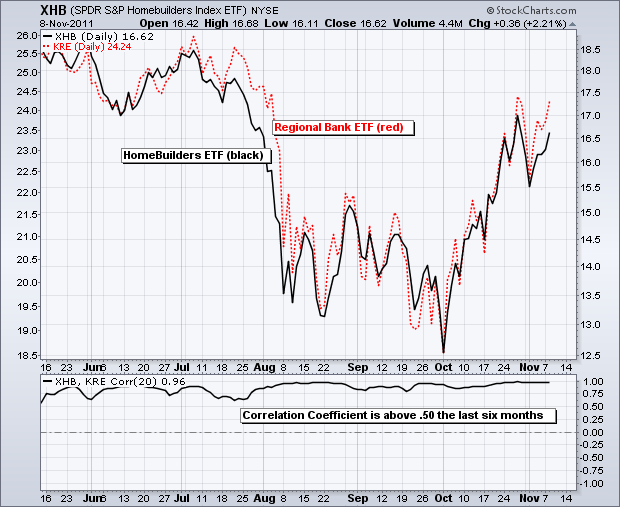
The Regional Bank SPDR (KRE) and the Homebuilders SPDR (XHB) have been leading the market higher since early October. Both bottomed with the October 3rd close and surged over 20% the last five weeks. Also notice how these two are moving step-for-step. KRE is red and XHB is black... Read More
Don't Ignore This Chart! November 08, 2011 at 03:34 AM
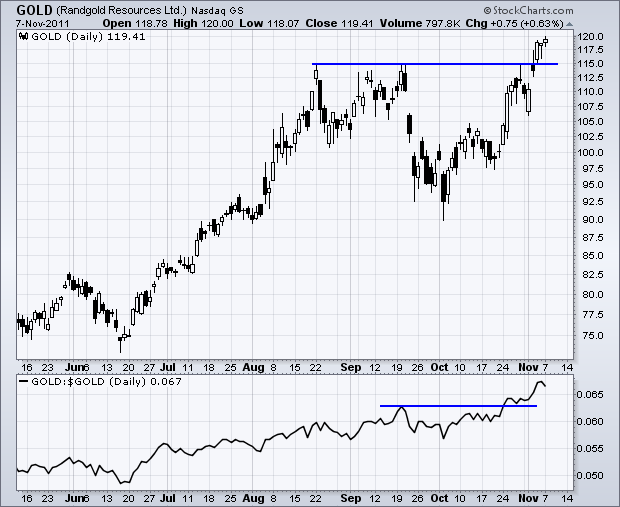
Randgold Resources (GOLD) is leading the gold miners and gold with a new 52-week high the last few days. Also note that Randgold broke resistance with a move above 115. The indicator window shows Randgold relative to gold with a ratio plot (GOLD:$GOLD)... Read More
Don't Ignore This Chart! November 04, 2011 at 11:26 PM
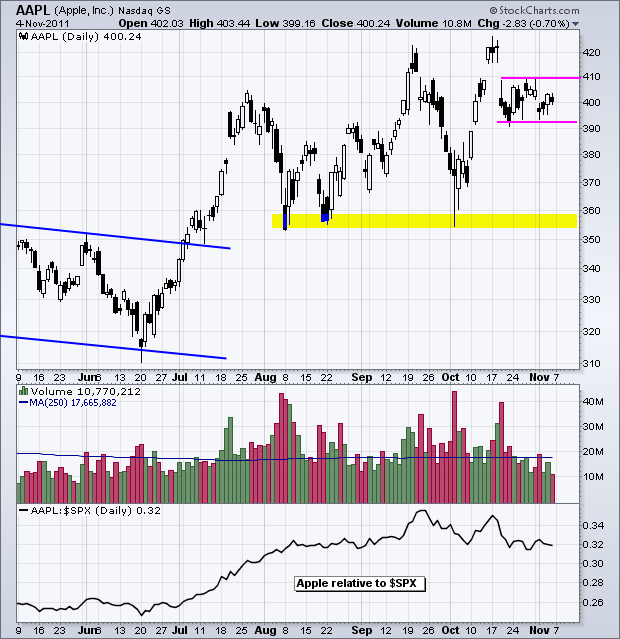
Apple Corp (AAPL), which accounts for around 14% of the Nasdaq 100 ETF (QQQ), gapped down in mid October and then consolidated. This low volume consolidation now looks like a flat flag. Watch the boundaries for the next directional clue. Any move Apple will affect QQQ... Read More
Don't Ignore This Chart! November 03, 2011 at 11:54 PM
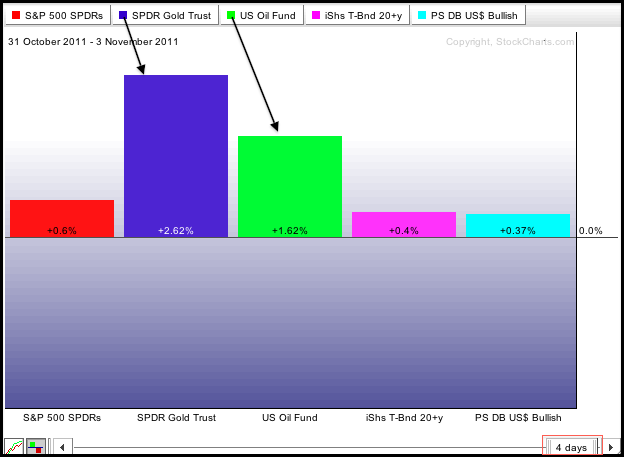
The PerfChart below shows the performance for five intermarket ETFs. The Gold SPDR (GLD) and the US Oil Fund (USO) sport the biggest gains and are clearly leading the group. The 20+ year Bond ETF (TLT) and US Dollar Fund (UUP) have the smallest gains and are lagging... Read More
Don't Ignore This Chart! November 02, 2011 at 09:43 PM
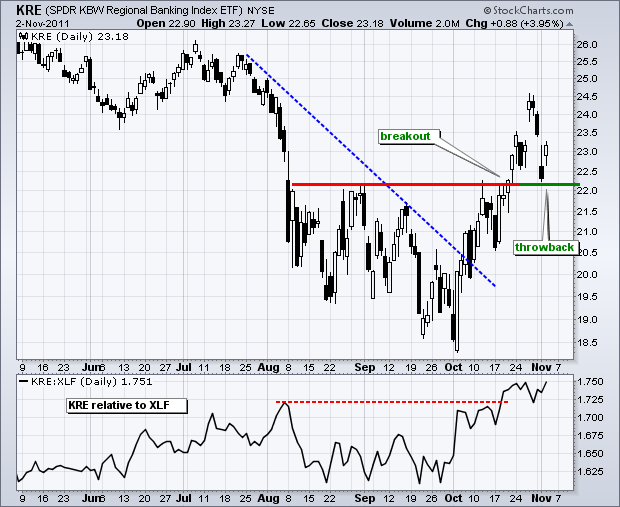
The Regional Bank SPDR (KRE) broke resistance with the October surge and broken resistance turned into support. This is a basic tenet of technical analysis. The throwback to broken resistance held (so far) as the ETF bounced back above 23 on Wednesday... Read More
Don't Ignore This Chart! November 01, 2011 at 03:18 PM
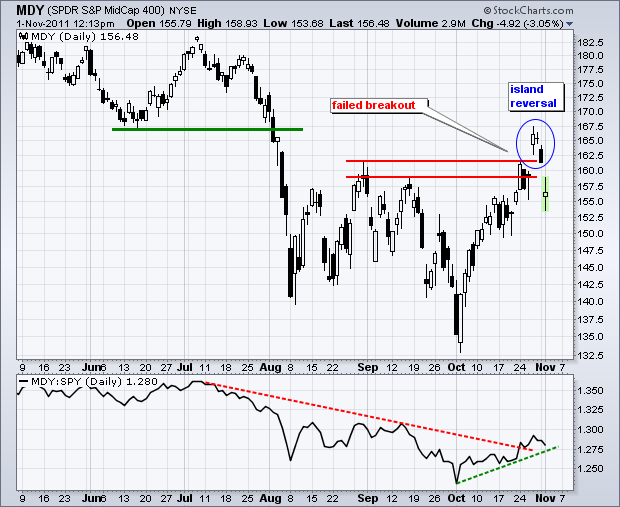
With a gap down and sharp decline the last two days, the S&P MidCap 400 SPDR (MDY) failed to hold the resistance breakouts around 160. Also notice that the ETF formed an island reversal, Last Thursday's gap was countered by today's gap to create a three-day price island... Read More
Don't Ignore This Chart! October 31, 2011 at 09:22 PM
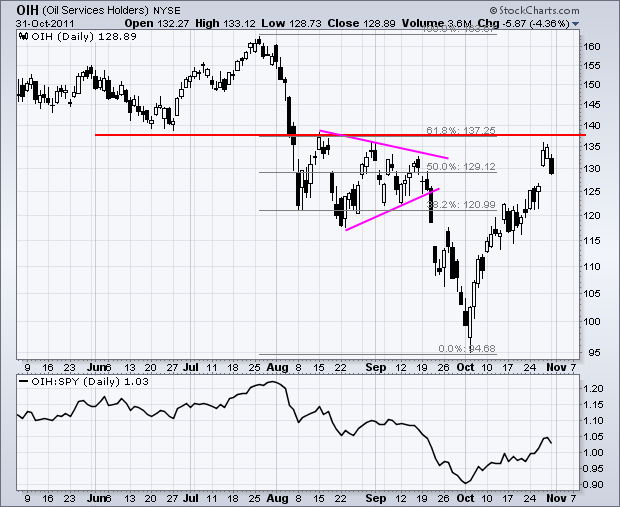
The Oil Service HOLDRS (OIH) surged over 30% in October and hit resistance in the 137 area. Resistance here stems from broken support and the August highs. This level also marks a 61.80% retracement of the prior decline and the ETF is quite overbought after the October run... Read More