Don't Ignore This Chart! January 31, 2012 at 05:40 PM
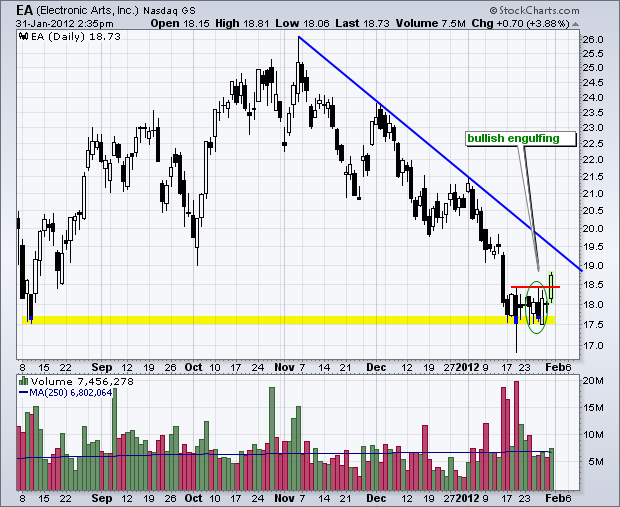
Electronic Art (ERTS) declined to the August low in mid January and then firmed the last two weeks. A bullish engulfing formed on Friday as the stock opened weak and closed strong. ERTS follow up on this pattern with a breakout on above average volume... Read More
Don't Ignore This Chart! January 30, 2012 at 03:24 PM
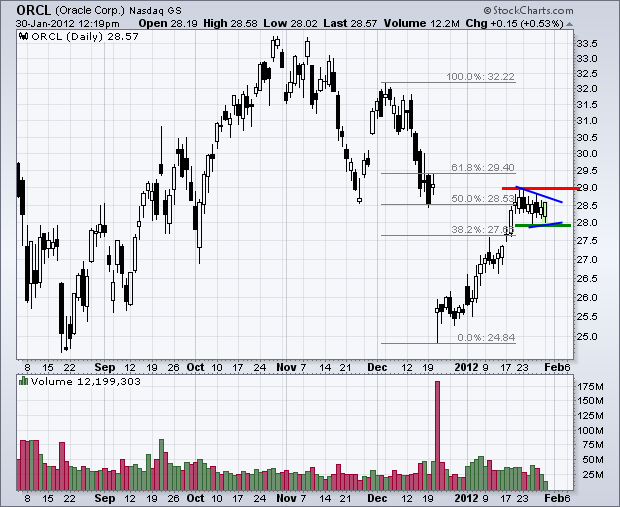
Oracle (ORCL) surged back above 28 this month, but stalled the last few weeks as resistance came into play. First, notice that broken support turns resistance around 28.50. Second, the stock retraced 50-61.80% of the prior decline... Read More
Don't Ignore This Chart! January 27, 2012 at 11:27 AM
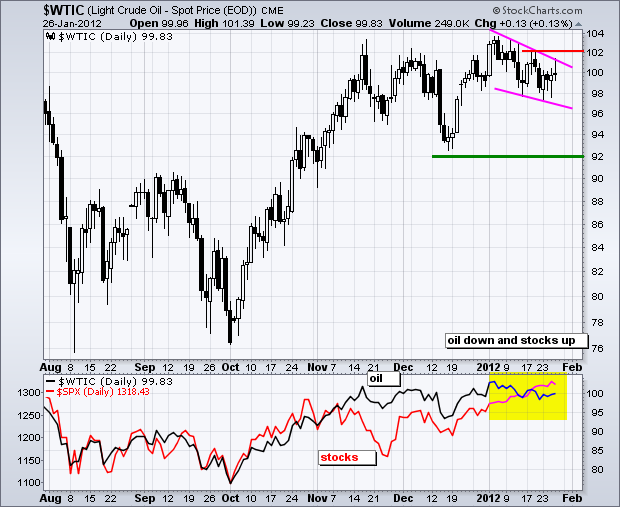
Spot Light Crude ($WTIC) surged above 100 in the second half of December and then formed a falling wedge in January. A decline in oil is unusual because the Dollar is down over the last few weeks and stocks are up... Read More
Don't Ignore This Chart! January 26, 2012 at 04:40 PM
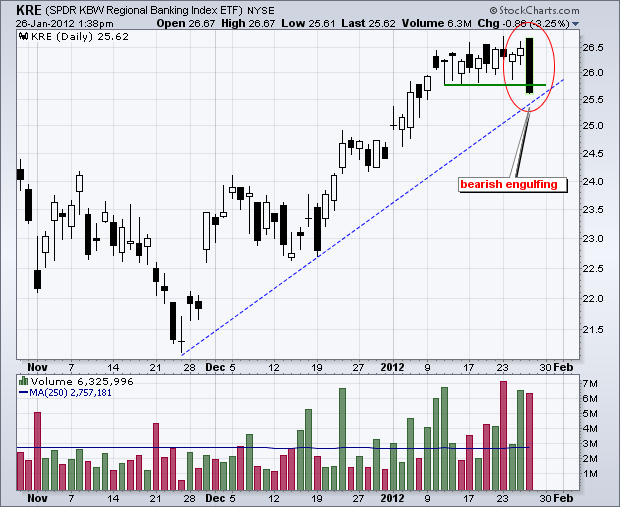
With stocks opening strong and then moving sharply lower, the intraday bearish engulfing scan is filling up quite quickly. Of note, the Regional Bank SPDR (KRE) has a bearish engulfing in play on Thursday afternoon... Read More
Don't Ignore This Chart! January 25, 2012 at 04:49 PM
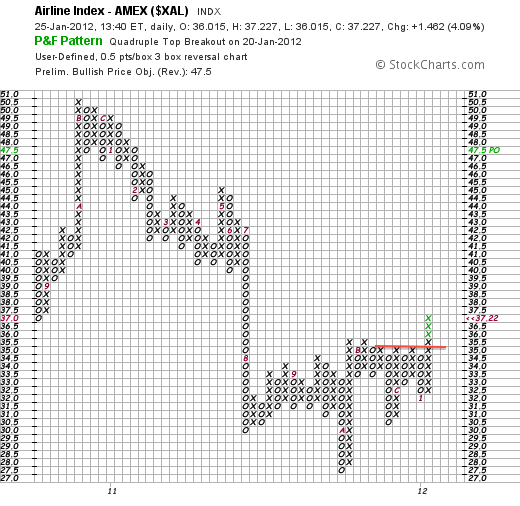
The Amex Airline Index ($XAL) lagged the market throughout 2011, but may be poised to lead with a breakout in 2012. The P&F chart below is a classic three box reversal chart with each box representing 50 cents... Read More
Don't Ignore This Chart! January 24, 2012 at 02:57 PM
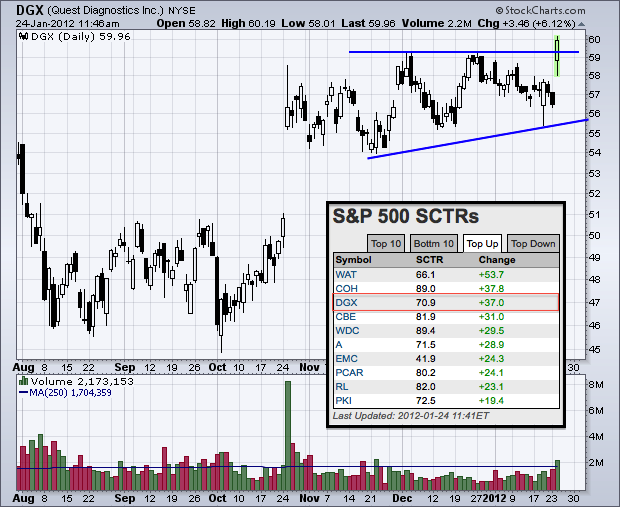
A look at the StockCharts Technical Rank (SCTR) movers shows Quest Diagnostics with a big move (+37) on Tuesday. On the price chart, DGX broke ascending triangle resistance with a surge in volume today... Read More
Don't Ignore This Chart! January 23, 2012 at 08:35 PM
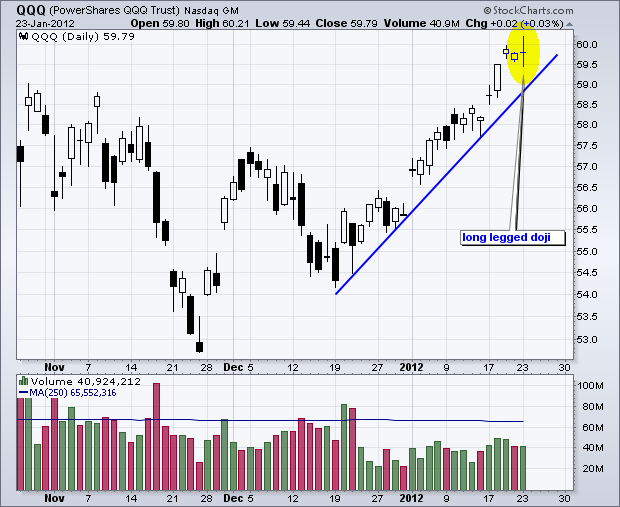
QQQ opened flat, surged, dipped and then recovered to close basically unchanged on the day. As a result, the ETF formed a long legged doji, which shows indecision on the day. Overall, the trend remains up as the ETF holds above the December trendline... Read More
Don't Ignore This Chart! January 20, 2012 at 02:34 PM
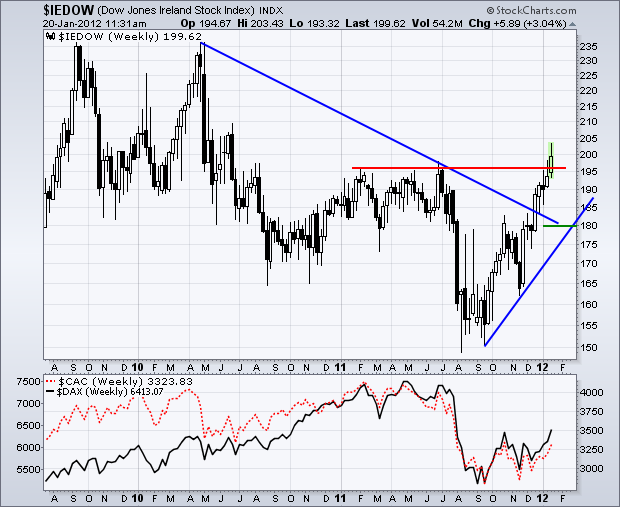
While the German DAX Index ($DAX) and the French CAC Index ($CAC) languish well below their 2011 highs, the DJ Ireland Index ($IEDOW) shows strength with a break above its highs... Read More
Don't Ignore This Chart! January 19, 2012 at 06:24 PM
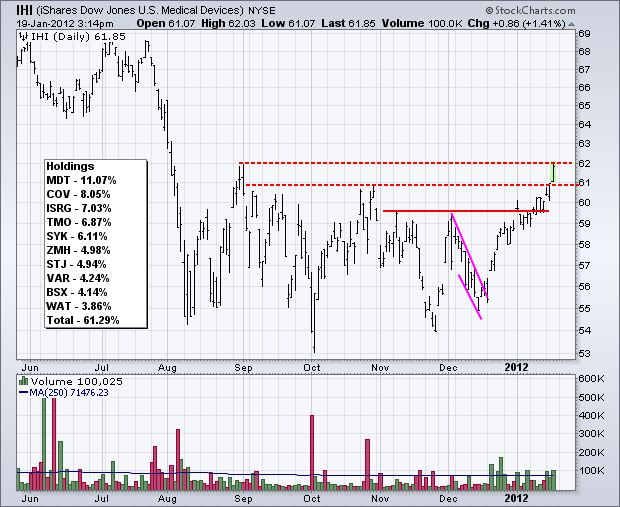
The Medical Devices iShares (IHI) has been moving higher since mid December and is now challenging its late summer high. Also notice that upside volume picked up over the last 4-5 weeks... Read More
Don't Ignore This Chart! January 18, 2012 at 04:14 PM
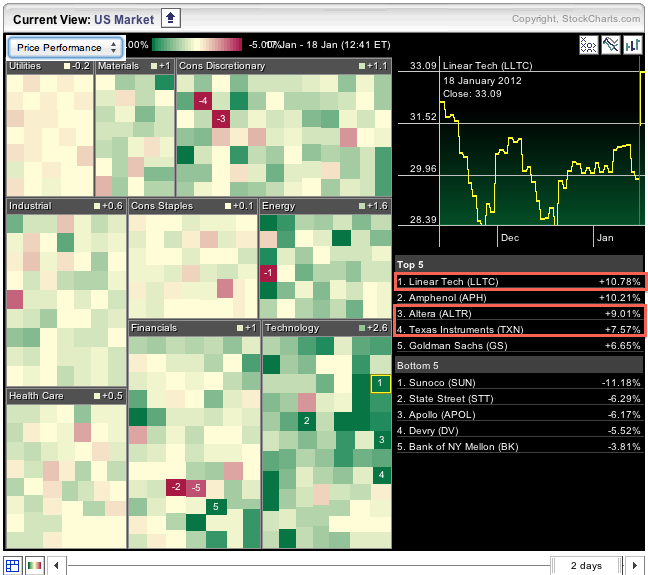
Stocks were largely higher on Wednesday with the technology sector leading the way. As the Sector Market Carpet shows, three of the top five performers in the technology sector come semiconductor group: Linear Tech (LLTC), Altera (ALTR) and Texas Instruments (TXN)... Read More
Don't Ignore This Chart! January 17, 2012 at 02:54 PM
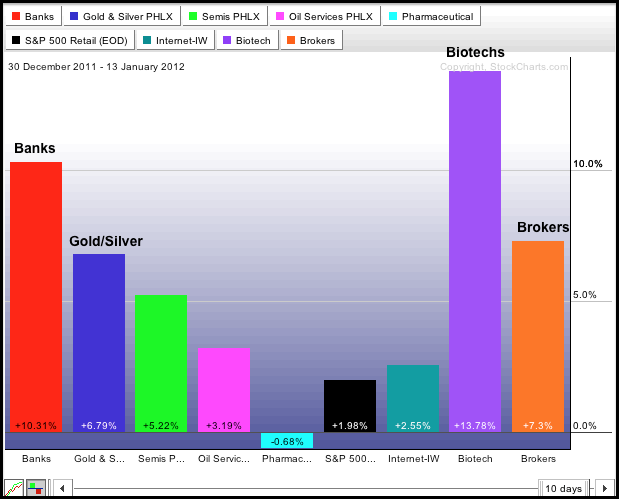
John Murphy's industry group PerfChart shows the Banking Index ($BKX) and the Biotech Index ($BTK) leading the market higher with the biggest gains. Also note that the Gold and Silver Index ($XAU) and the Broker Dealer Index ($XBD) are strong this year... Read More
Don't Ignore This Chart! January 13, 2012 at 03:32 PM
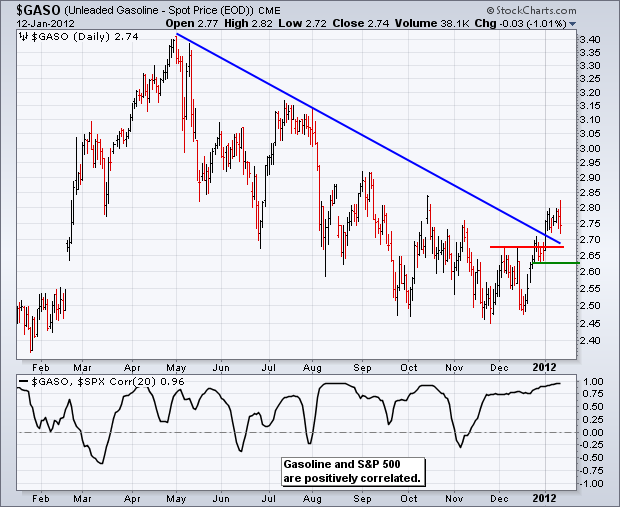
Spot Unleaded Gasoline ($GASO) found support in the 2.45-2.50 area from September to December and then broke resistance with a surge the last three weeks. The breakout is holding, but $GASO stalled this week and fell rather sharply on Thursday. A move back below 2... Read More
Don't Ignore This Chart! January 12, 2012 at 05:51 PM
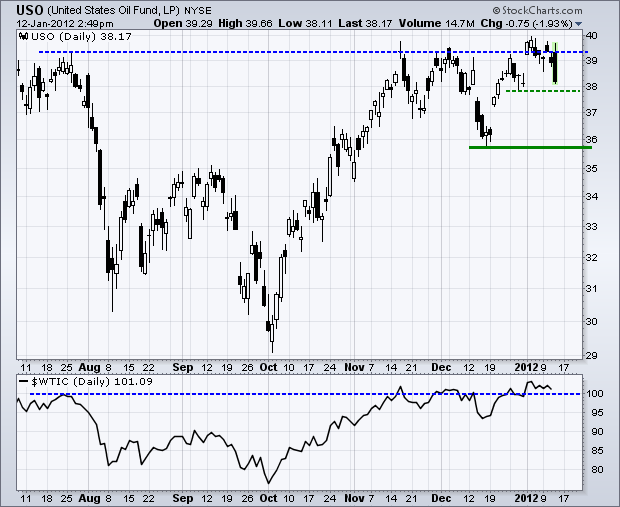
The US Oil Fund (USO) started the year strong with a surge above 39, but cannot hold above this level as the ETF plunged over 1.5% on Thursday. USO was also turned back in the 39-40 area in November and December... Read More
Don't Ignore This Chart! January 11, 2012 at 07:14 PM
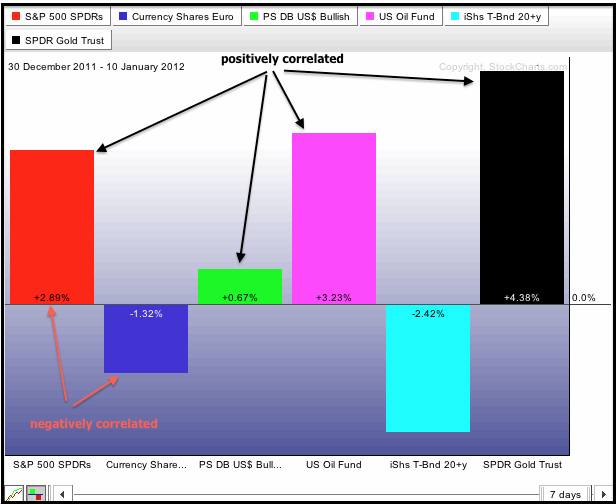
The PerfChart below shows six intermarket related ETFs. The S&P 500 ETF (SPY), US Oil Fund (USO) and Gold SPDR (GLD) are positively correlated as all show gains in 2012... Read More
Don't Ignore This Chart! January 10, 2012 at 06:07 PM
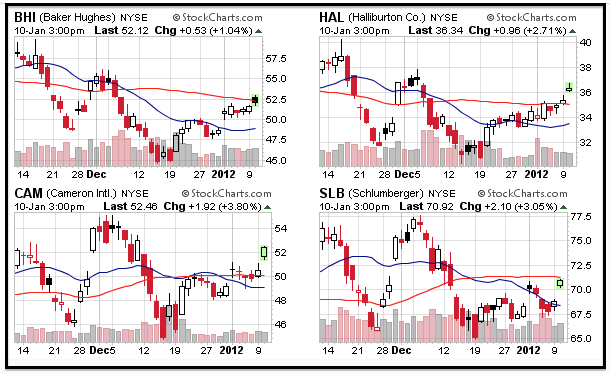
A look through the CandleGlance groups shows stocks in the oil equipment and services group moving higher on Tuesday. The image below shows four of the six stocks along with the DJ Oil Equipment & Services Index ($DJUSOI)... Read More
Don't Ignore This Chart! January 09, 2012 at 05:39 PM
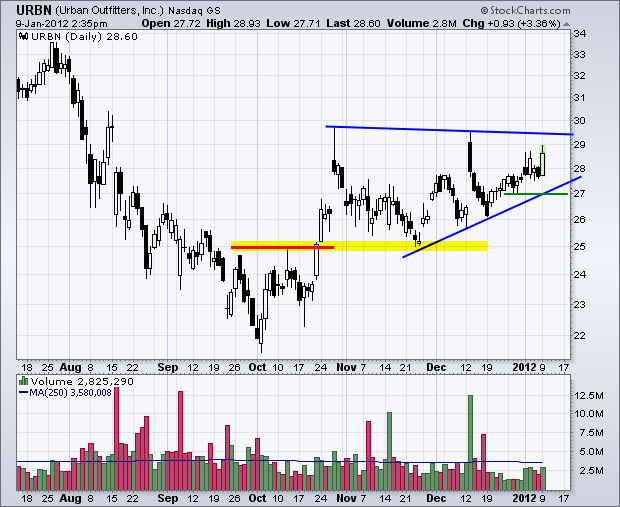
Urban Outfitters (URBN) is showing signs of life with a move toward the upper trendline of a triangle consolidation. The stock is currently up three of the last five days, but volume is light. A breakout on surging volume would be bullish... Read More
Don't Ignore This Chart! January 06, 2012 at 03:15 PM
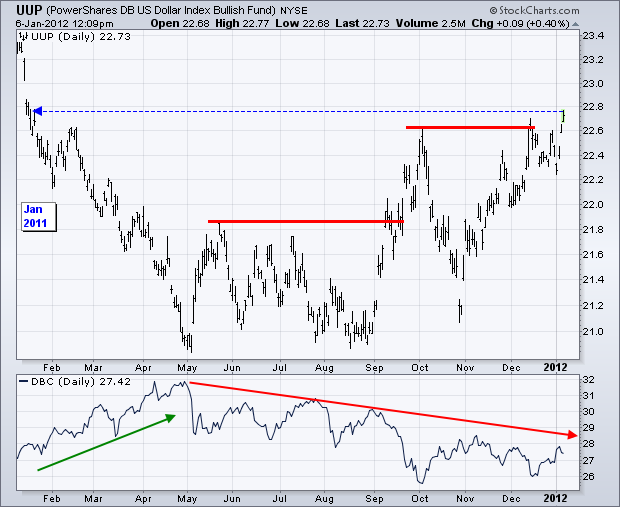
The US Dollar Fund (UUP) broke above its October high and is closing in on a 52-week high this month. With higher highs in September, December and January, the trend here is clearly up. The Commodity Index Fund ($DBC) is not happy though... Read More
Don't Ignore This Chart! January 05, 2012 at 06:55 PM
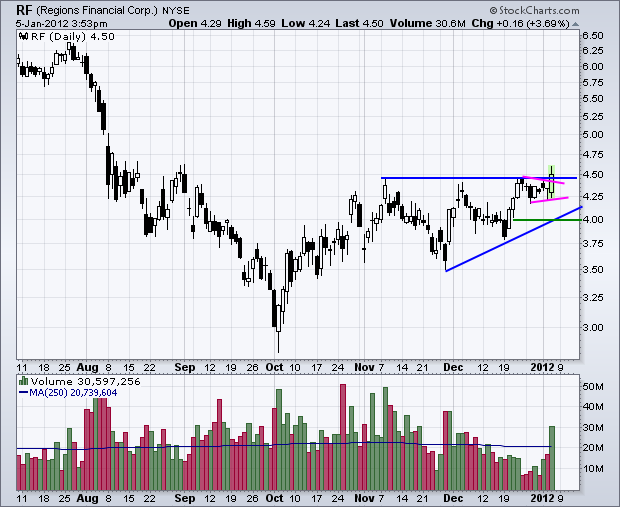
Regions Financial (RF), which is part of the regional banking group, is showing strength with a break above the November-December highs on surging volume. Prior to today's breakout, the stock consolidated with a seven day pennant. Watch support in the 4-4... Read More
Don't Ignore This Chart! January 04, 2012 at 06:21 PM
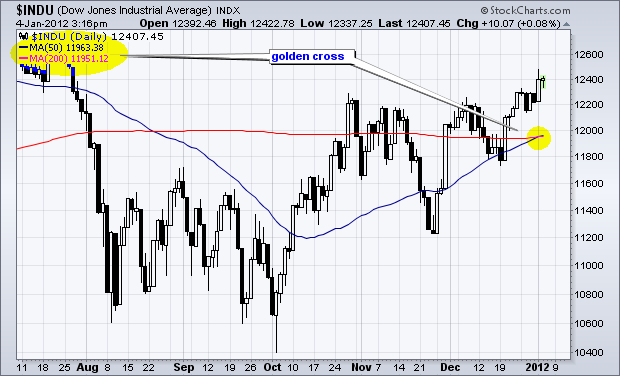
The technical picture for Dow is improving as the 50-day simple moving average crossed above the 200-day simple moving average. Note that the 50-day SMA has not been above the 200-day SMA since August... Read More
Don't Ignore This Chart! January 03, 2012 at 06:23 PM
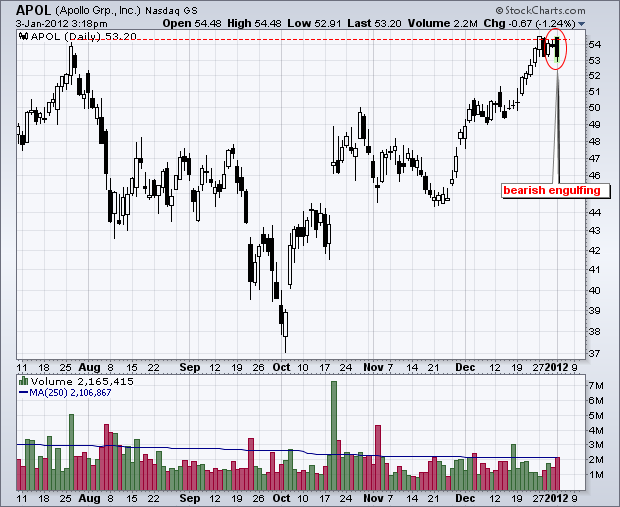
Apollo (APOL) opened strong and moved lower to trace out a bearish engulfing during the day on Tuesday. It is interesting that APOL is not moving higher with the market and that this bearish candlestick pattern formed at resistance... Read More