Don't Ignore This Chart! May 31, 2012 at 07:27 PM
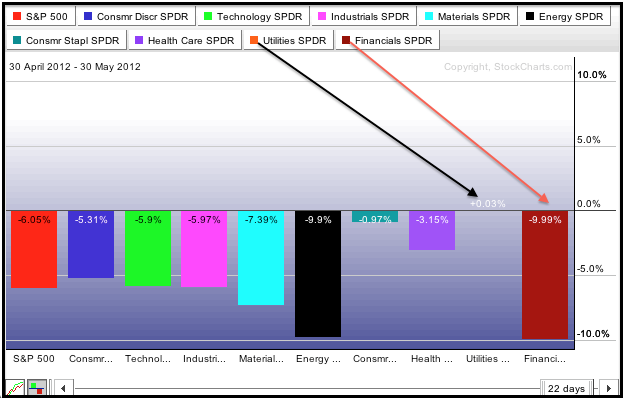
The S&P Sector PerfChart shows the percentage change for the nine sector SPDRs and the S&P 500 for the month of May. Eight of nine sectors are down with finance leading the day (down around 10%)... Read More
Don't Ignore This Chart! May 30, 2012 at 07:52 PM
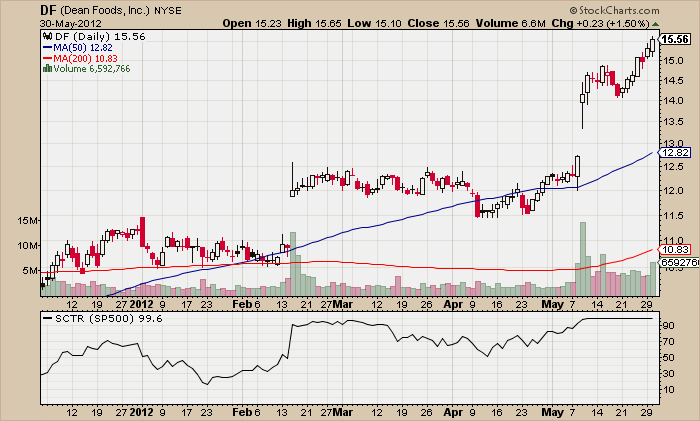
Has anyone else noticed how well Dean Foods (DF) has been doing recently? DF has had a top SCTR score for a while now and it continues to move higher. Don't forget to check the SCTR pages frequently to find similarly strong stocks... Read More
Don't Ignore This Chart! May 30, 2012 at 08:30 AM
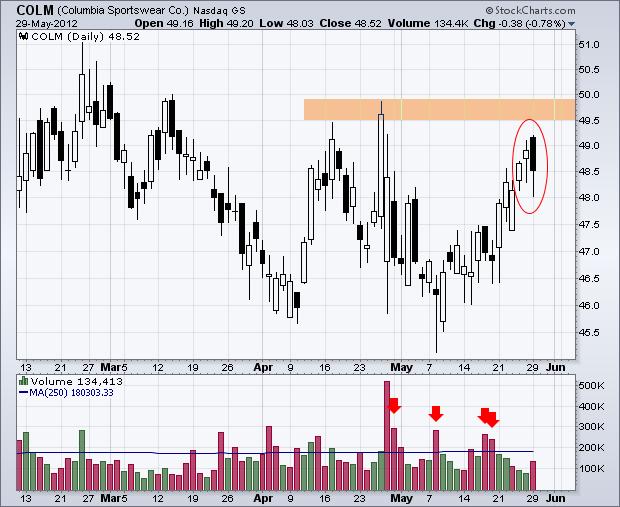
After a rise the last three weeks, COLM hit a pocket of selling pressure and formed a bearish engulfing just below its April highs. This pattern formed even as the S&P 500 closed higher. Also notice that downside volume has consistently outpaced upside volume since late April... Read More
Don't Ignore This Chart! May 29, 2012 at 03:14 PM
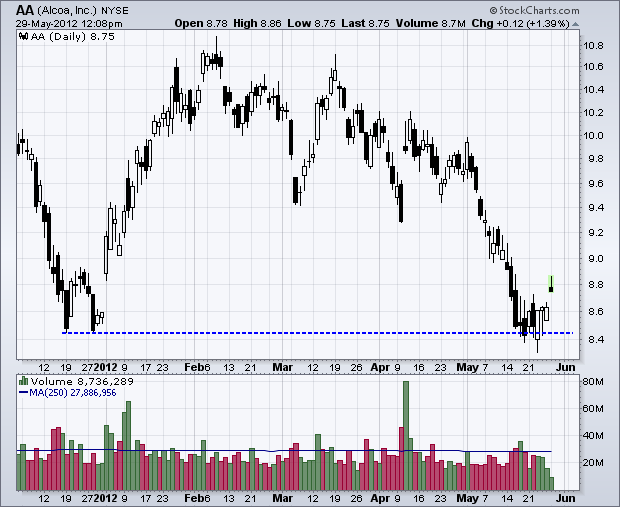
After returning all the way to the December lows in May, Alcoa (AA) firmed last week and started this week with a gap higher. There is some support here, but the trend since early February is down and this gap is on low volume (so far)... Read More
Don't Ignore This Chart! May 25, 2012 at 08:20 AM
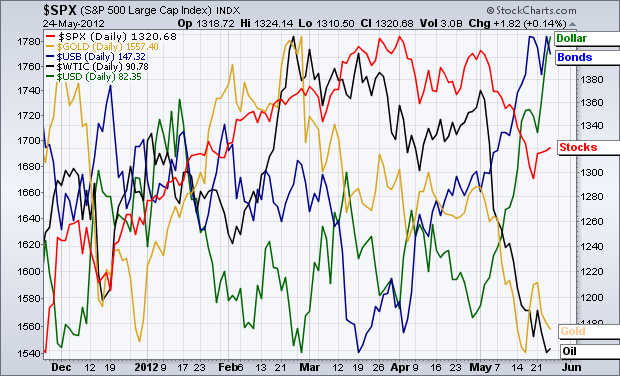
This chart cover the recent shift to risk-off. The US Dollar Index ($USD) and the 30-Year US Treasury ($USB) are leading over the last six months as both trade near six month highs. Spot Gold ($GOLD) and Spot Light Crude ($WTIC) are lagging as both trade near six month lows... Read More
Don't Ignore This Chart! May 24, 2012 at 02:25 PM
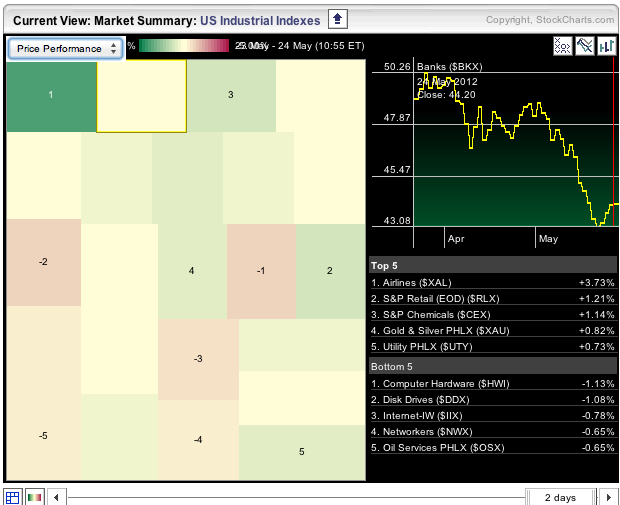
The image below shows the Market Summary Market Carpet zoomed in on the industry groups. (Note: click the heading to zoom in on a ground). Right away the Amex Airline Index ($XAL) stands out with a dark green square. This means it is leading with the biggest gains... Read More
Don't Ignore This Chart! May 23, 2012 at 01:56 PM
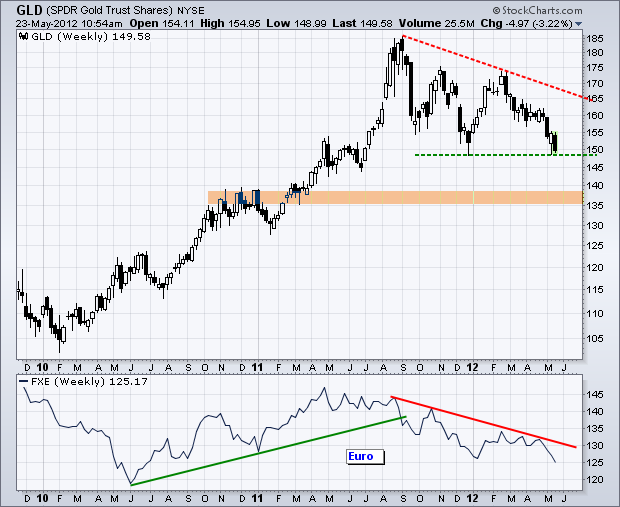
The Gold SPDR (GLD) gave back last week's gain with a sharp decline the last three days and is on the verge of breaking support. The next support zone resides in the 135-138 area... Read More
Don't Ignore This Chart! May 22, 2012 at 03:20 PM
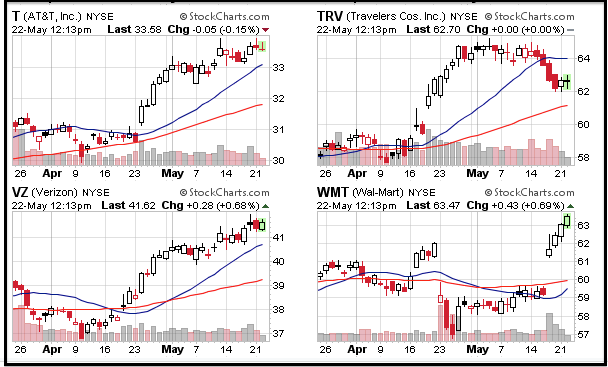
A review of the CandleGlance charts for the thirty Dow stocks shows only five components trading above their 20-day and 50-day moving averages: AT&T, Disney, Pfizer, Wal-mart and Verizon... Read More
Don't Ignore This Chart! May 21, 2012 at 12:42 PM
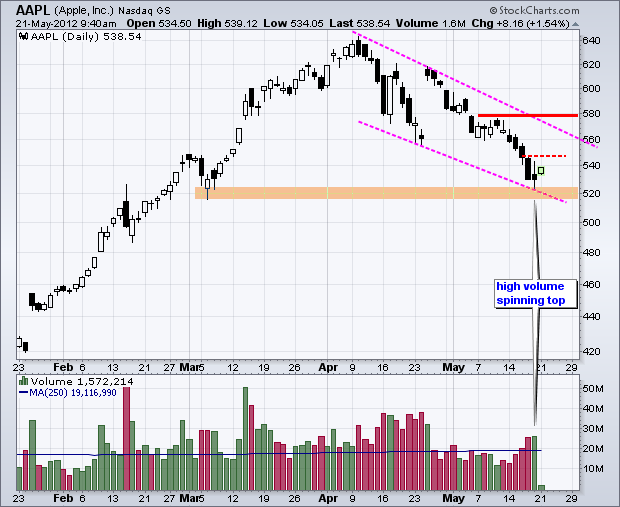
Apple suffered its biggest six week decline since 2008, but signs of firmness emerged as the stock formed a spinning top at the end of last week. Spinning tops represent indecision that can sometimes foreshadow a reversal. Also note that this candlestick formed with high volume... Read More
Don't Ignore This Chart! May 18, 2012 at 10:23 AM
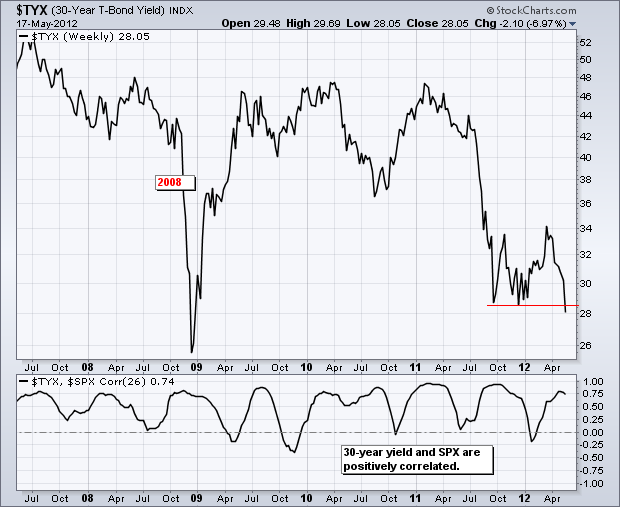
The 30-year Treasury Yield ($TYX) broke down with a sharp decline the last few weeks. This puts the yield near its 2011 lows and within striking distance of its 2008 lows, scene of the last crisis and flight to safety... Read More
Don't Ignore This Chart! May 17, 2012 at 04:46 PM
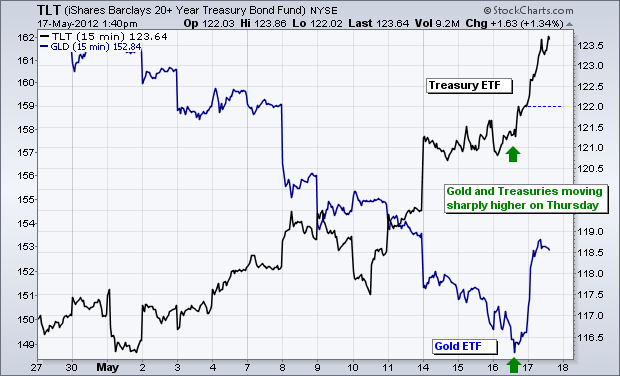
The Gold SPDR (GLD) and the 20+ Year T-Bond ETF (TLT) have been negatively this month. Notice how TLT advanced from 116 to 123.5 and GLD declined from 161 to 150 the prior 11 days. This negative correlation changed today as both surged higher... Read More
Don't Ignore This Chart! May 16, 2012 at 03:31 PM
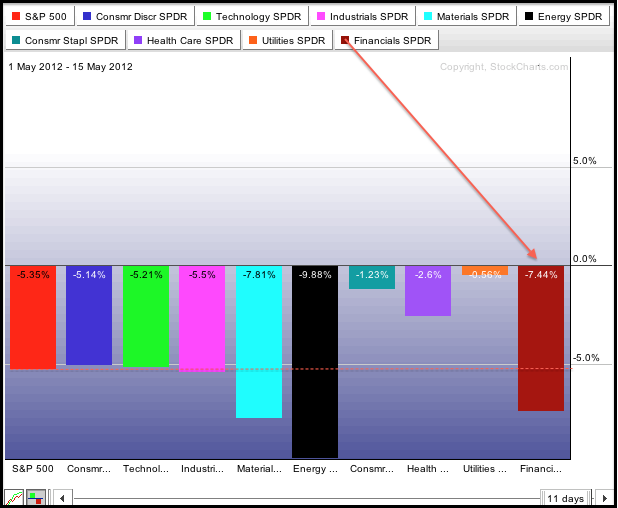
May has been nothing but mayhem for the market as all nine sectors moved lower. The PerfChart below shows the percentage change since May 1st. Over the last 11 trading days, the Finance SPDR (XLF), Energy SPDR (XLE) and Basic Materials SPDR (XLB) are leading the market lower... Read More
Don't Ignore This Chart! May 15, 2012 at 11:36 AM
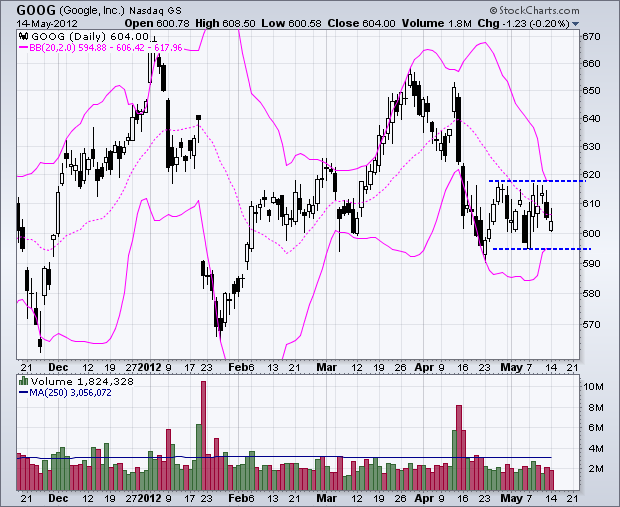
After a big decline in April, Google ($GOOG) consolidated the last few weeks and the Bollinger Bands narrowed significantly. This could be called a Bollinger Band squeeze or volatility squeeze. The next directional signal depends on the band break... Read More
Don't Ignore This Chart! May 11, 2012 at 10:54 AM
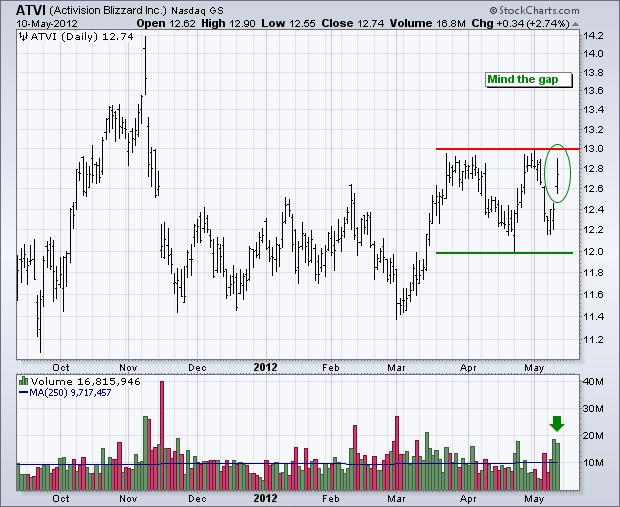
Stocks were under pressure the last three days, but ATVI bucked the trend with an advance and gap on high volume. This gap off support is bullish as long as it holds. Resistance at 13 marks the next challenge... Read More
Don't Ignore This Chart! May 10, 2012 at 02:03 PM
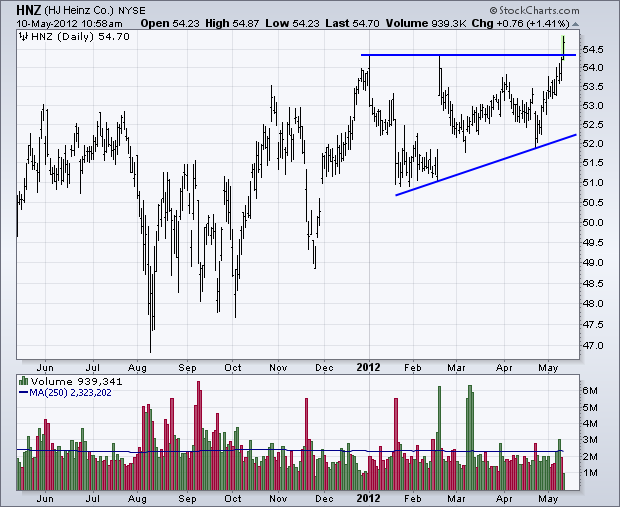
The Consumer Staples SPDR (XLP) remains one of the strongest sectors and Heinze is part of that strength with an ascending triangle breakout. With a surge the last two weeks, the stock broke above its January-February highs and entered uncharted territory... Read More
Don't Ignore This Chart! May 09, 2012 at 10:07 AM
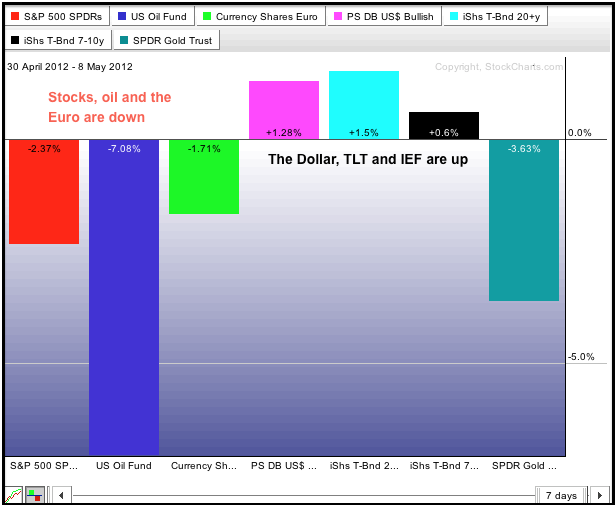
The PerfChart below shows the percentage change for seven intermarket ETFs. The three risk assets (stocks, oil, euro) are down, while the three safe havens are up (dollar, treasuries). Gold is going against the Dollar and along with the stock market... Read More
Don't Ignore This Chart! May 07, 2012 at 03:18 PM
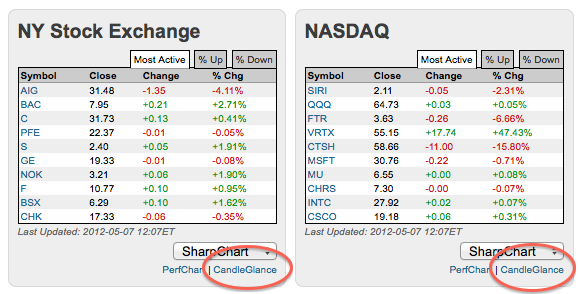
Even though stocks opened lower on Monday, market action quickly turned mixed, as evidenced on the most active tables for the Nasdaq and NYSE. Chartists can see the intraday action by clicking the CandleGlance links... Read More
Don't Ignore This Chart! May 04, 2012 at 03:09 PM
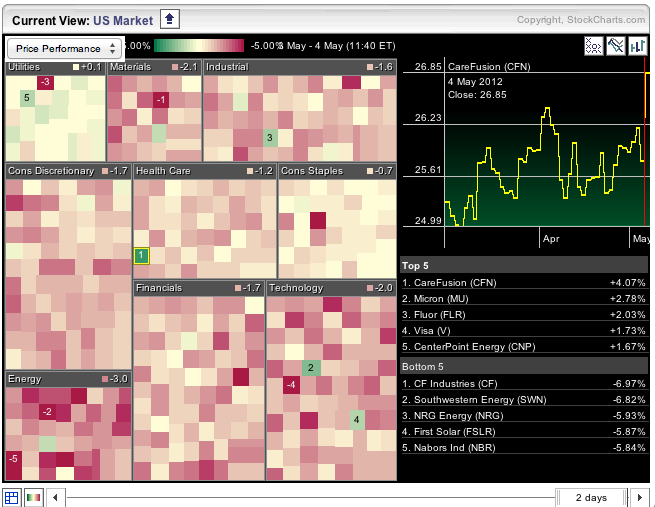
Stocks were down sharply in early trading on Friday with the energy sector showing the most red in the Sector Carpet. There are, however, usually a few stocks bucking the trend and these can be found by looking for the isolated patches of green... Read More
Don't Ignore This Chart! May 03, 2012 at 02:04 PM
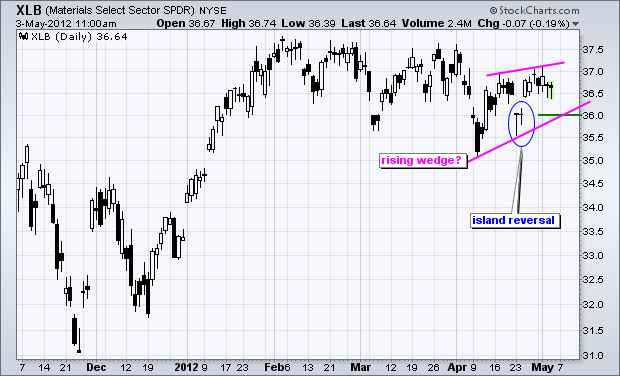
The Basic Materials SPDR (XLB) reversed higher last week with an island reversal, but stalled over the last 4-5 days and a rising wedge is taking shape. For now, the gap and island reversal dominate the chart. A move below 36 would fill this gap and break the wedge trendline... Read More
Don't Ignore This Chart! May 02, 2012 at 07:26 PM
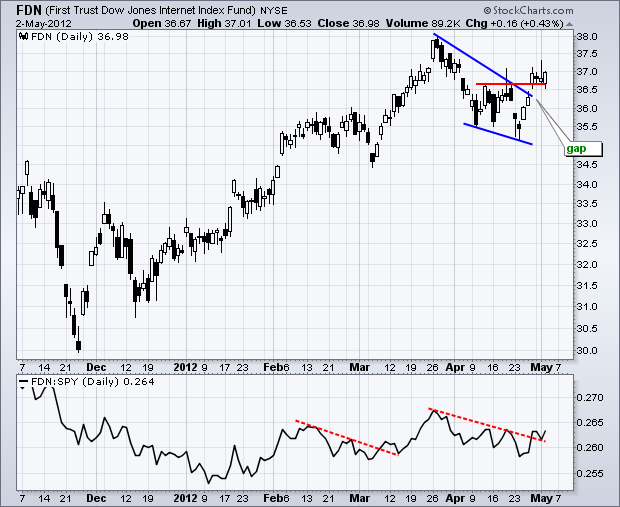
The FirstTrust Internet ETF (FDN) broke out with a gap last week and that gap is holding. Mind that gap! The gap is bullish as long as it holds... Read More
Don't Ignore This Chart! May 01, 2012 at 03:17 PM
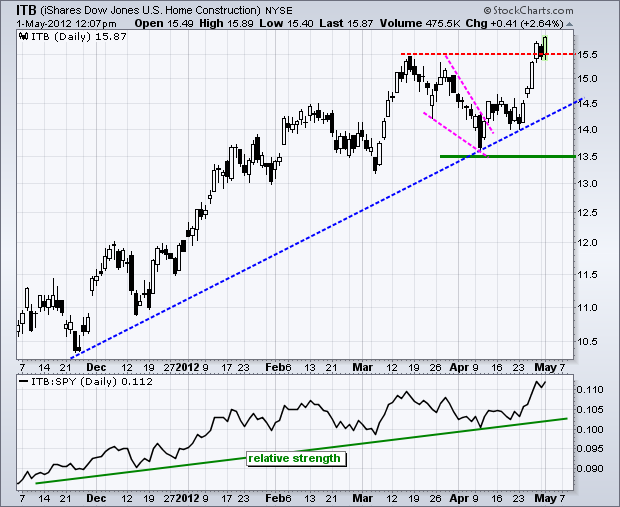
The Home Construction iShares (ITB) is leading the market higher again with a fresh 52-week high this week. The chart below also shows the Price Relative (ITB:SPY ratio) hitting a new high. Below this chart is a snapshot from today's new high list... Read More