Don't Ignore This Chart

Dow Challenges Spring Highs on 30pt Point & Figure Chart

 | 
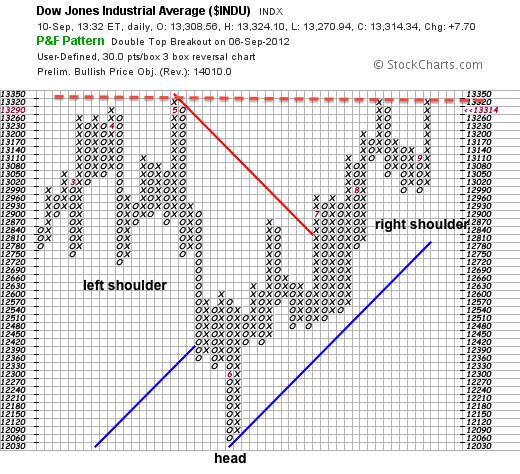
The P&F chart below shows the Dow Industrials using 30 points per box and a three box reversal method. With the August dip and September surge, the Dow is challenging the prior highs and tracing out a large inverse head-and-shoulders pattern. A break above these highs opens the door to even higher prices.
120910indu
Click this image for a live chart
Arthur Hill
About the author: , CMT, is a Senior Technical Analyst at StockCharts.com. He has written articles for numerous financial publications including Barrons and Stocks & Commodities magazine. Focusing predominantly on US equities and ETFs, his systematic approach of identifying trend, finding signals within the trend, and setting key price levels has made him an esteemed technician. In addition to his CMT designation, Arthur holds an MBA from the Cass Business School at City University in London. Learn More
Subscribe to Don't Ignore This Chart to be notified whenever a new post is added to this blog!
Good presentation. Very timely and appropriate. Thanks
Good call - now with a clearly breakout - Prelim. Bullish Price Obj. is encouraging. Thank you very much, Dirk
comments powered by Disqus