Don't Ignore This Chart! October 31, 2012 at 01:06 PM
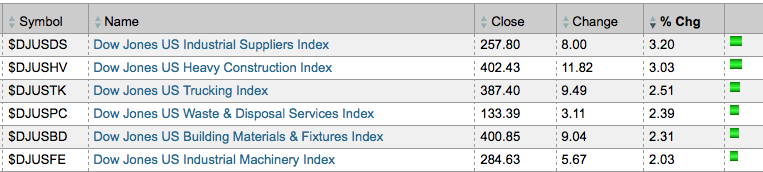
A look at the Dow Jones industry groups shows strength coming from the DJ US Building and Fixtures Index ($DJUSBD), the DJ US Industrial Suppliers Index ($DJUSDS) and the DJ US Heavy Construction Index ($DJUSHV)... Read More
Don't Ignore This Chart! October 30, 2012 at 04:08 PM
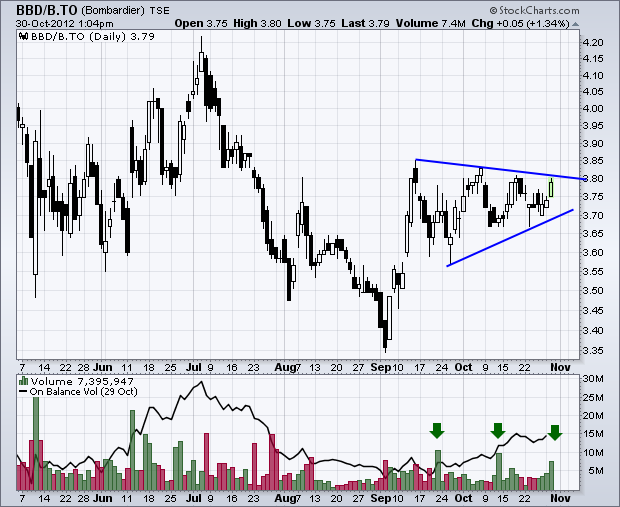
Bombardier (BBD/B.TO) got a big surge in early September and then formed an extended triangle the last six weeks. Upside volume within the triangle is picking up as OBV moves higher in the indicator window. A triangle breakout would signal a continuation of the September surge... Read More
Don't Ignore This Chart! October 29, 2012 at 06:02 PM
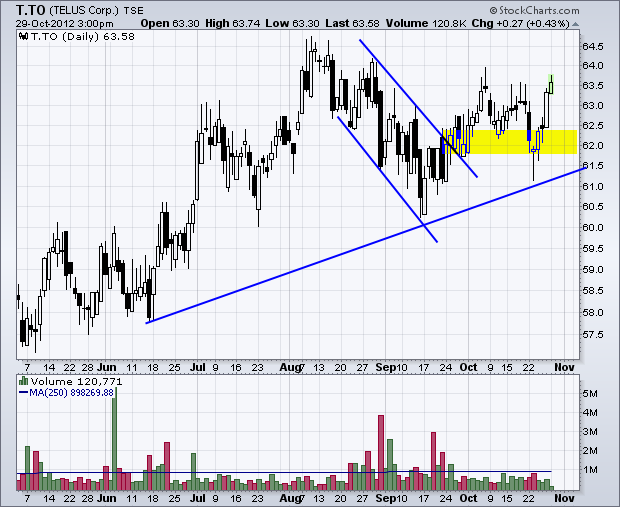
TELUS Corp (T.TO) is showing signs of price strength with a channel breakout in late September and a surge over the last four days. This four day surge reinforces support in the 61-62 area... Read More
Don't Ignore This Chart! October 26, 2012 at 03:21 PM
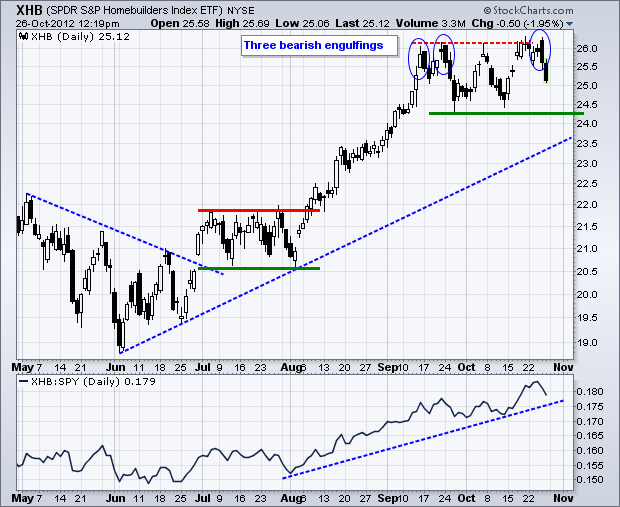
The uptrend in the Home Construction iShares (ITB) is stalling as three bearish engulfing patterns formed in the 26 area. ITB was poised to break resistance with a surge on Thursday, but failed to hold its gains and continued lower on Friday. The Sep-Oct lows mark key support... Read More
Don't Ignore This Chart! October 25, 2012 at 03:06 PM
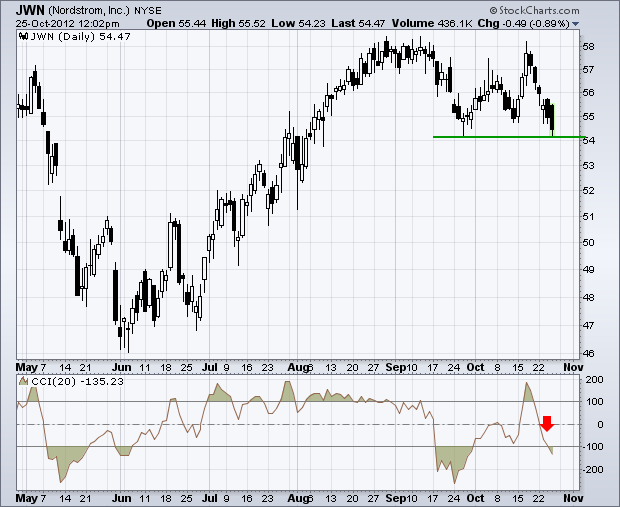
Nordstrom (JWN) surged last week, but gave back these gains with a sharp decline the last six days. JWN is now testing support from the late September low. Momentum abruptly shifted as well... Read More
Don't Ignore This Chart! October 24, 2012 at 03:03 PM
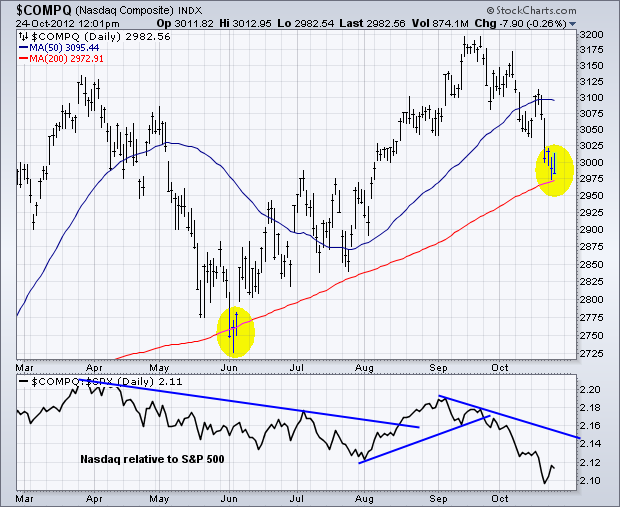
With a sharp decline the last five weeks, the Nasdaq is poised to test its rising 200-day moving average. The red line is the 200-day and this key average was last tested in early June... Read More
Don't Ignore This Chart! October 23, 2012 at 03:24 PM
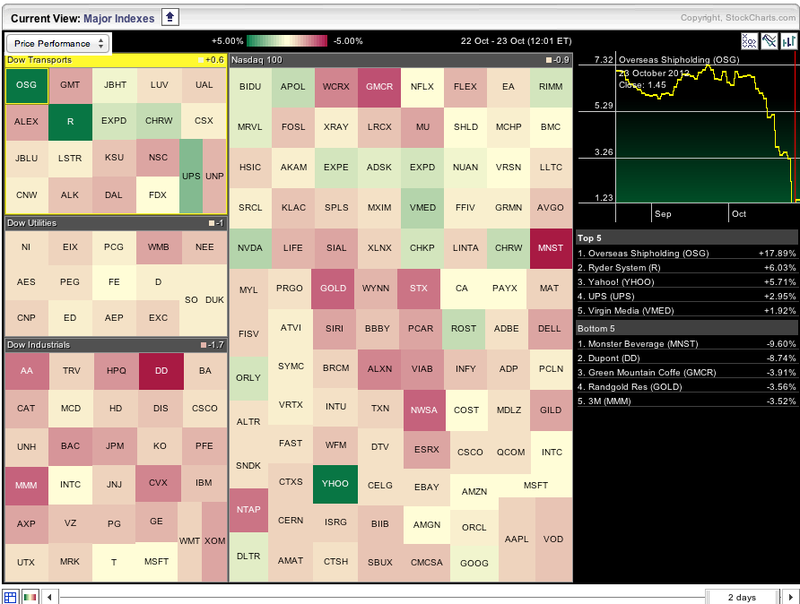
The image below comes from a Major Indices Market Carpet. The Dow Industrials is getting hit hard, but the Dow Transports is holding up rather well thanks for strength in UPS. The Nasdaq 100 ($NDX) is also holding up rather well with gains coming from Yahoo and Virgin Media... Read More
Don't Ignore This Chart! October 19, 2012 at 02:19 PM
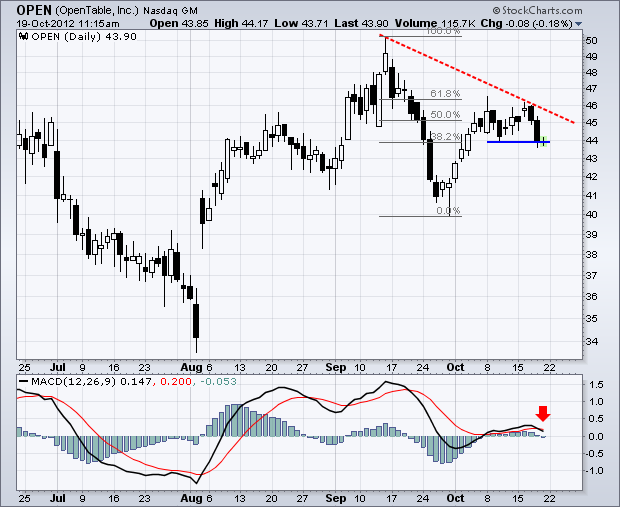
OpenTable (OPEN) shows signs of rolling over as a lower high takes shape and MACD moves below its signal line. Notice that OPEN hit resistance near the 61.80% retracement just above 46... Read More
Don't Ignore This Chart! October 18, 2012 at 08:26 PM
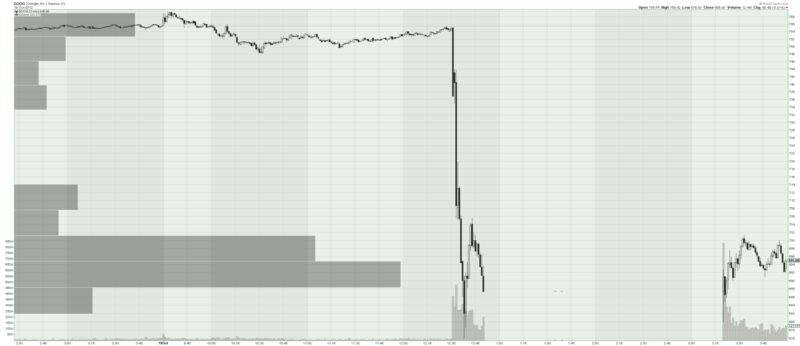
Here's a huge PRO-level chart of the 1-minute price action for Google today: (Be sure to click it once or twice in order to see it at its full size. PRO members can click here to see a live version.) Check out the two tiny test trades that got recorded between 1:30 and 1:45... Read More
Don't Ignore This Chart! October 18, 2012 at 06:25 PM
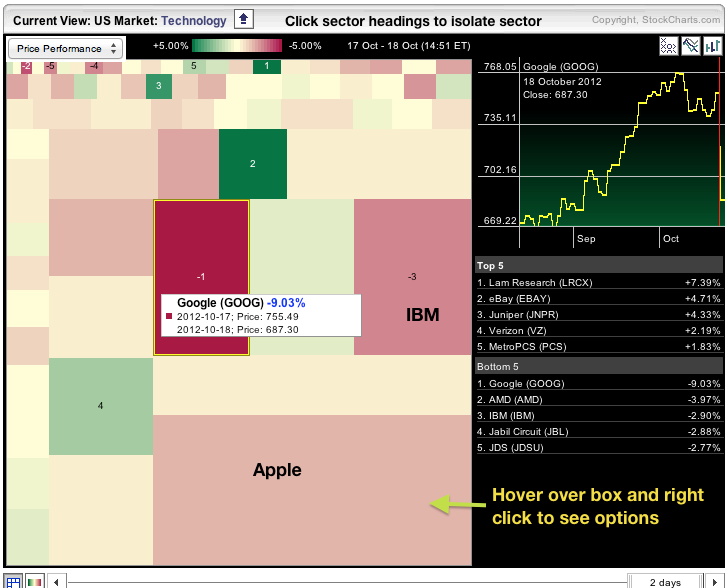
Now wonder the Technology SPDR (XLK) is getting slammed. The image below shows the technology sector in market capitalization mode on the Sector Carpet. Three of the biggest boxes are red. Google (1) is down the most, Apple (2) is down almost 2% and IBM (3) is down almost 3%... Read More
Don't Ignore This Chart! October 17, 2012 at 12:56 PM
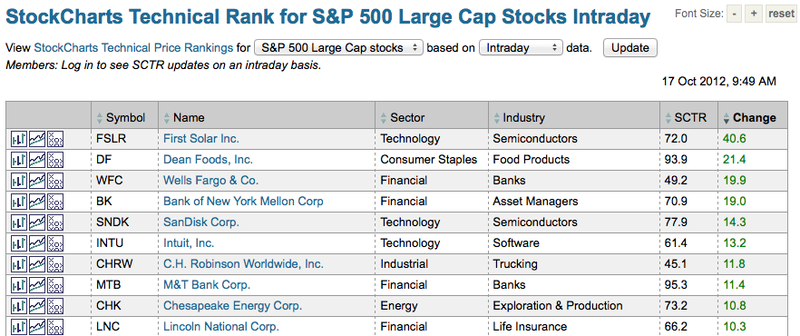
Chartists can use the StockCharts Technical Rank (SCTR) table on an intraday basis to find stocks making big moves. A sort of the "change" column shows First Solar and Dean Foods improving the most in early trading... Read More
Don't Ignore This Chart! October 16, 2012 at 06:15 PM
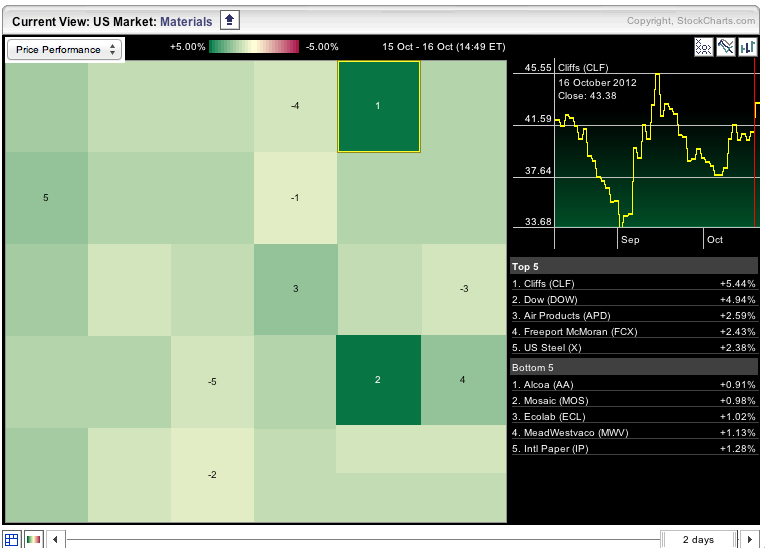
The Sector Market Carpet is a great way to find market leaders. Today, the Basic Materials SPDR (XLB) is the strongest sector with the average stock up around 1.9%. Drilling down into the sector shows all 30 components moving higher. Alcoa (AA) has the smallest gain (... Read More
Don't Ignore This Chart! October 15, 2012 at 01:16 PM
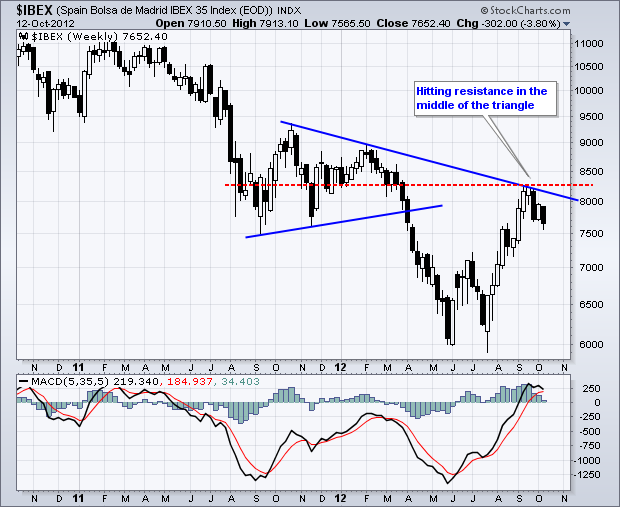
The Spain Bolsa de Madrid IBEX 35 Index ($IBEX) surged from mid July to mid September and turned back the last three weeks. Despite a 30% bounce off the lows, the index is still in a bigger downtrend and resistance is nigh... Read More
Don't Ignore This Chart! October 12, 2012 at 03:08 PM
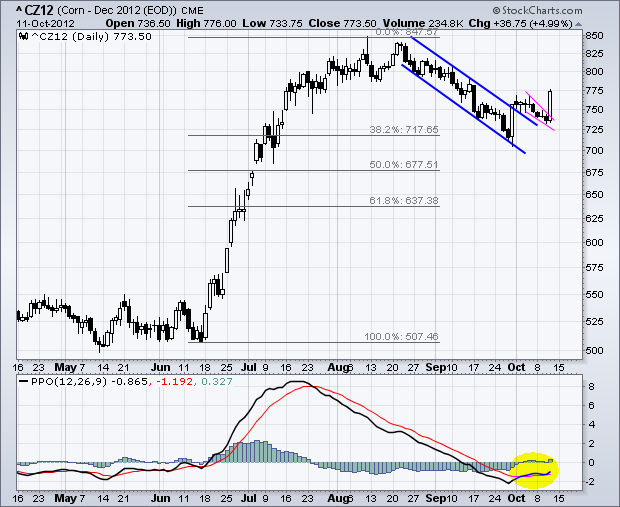
Corn surged during the summer drought news and then corrected as summer drew to a close. This correction appears to be ending as December Corn ($CZ12) broke channel resistance and the Percent Price Oscillator (PPO) turned up. This week's low now marks key support at 725... Read More
Don't Ignore This Chart! October 11, 2012 at 03:04 PM
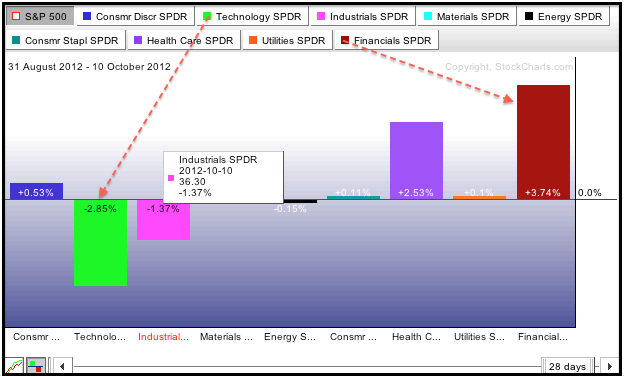
The Sector PerfChart shows the Finance SPDR (XLF) leading the S&P 500 since September and the Technology SPDR (XLK) lagging the S&P 500. These two sectors are by far the biggest sectors in the index... Read More
Don't Ignore This Chart! October 10, 2012 at 06:45 PM
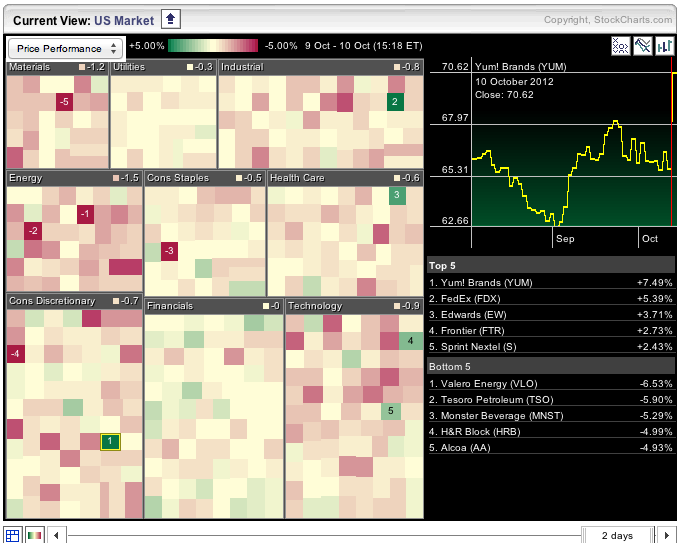
The Sector Market Carpet is mostly red on Wednesday, but there are some pockets of strength. Overall, the finance is holding up the best and the energy sector is faring the worst. The consumer discretionary and materials sectors also show red and relative weakness on Wednesday... Read More
Don't Ignore This Chart! October 09, 2012 at 03:03 PM
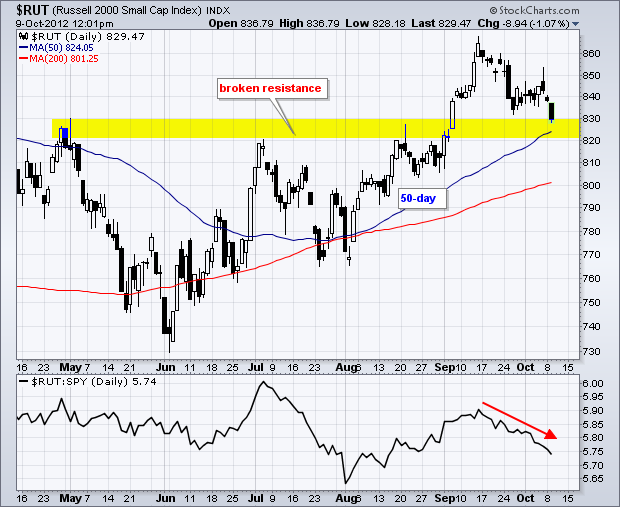
The Russell 2000 ($RUT) is leading the market lower and closing in on its rising 50-day simple moving average. Broken resistance from the May-August highs also marks potential support in the 820-830 area. Small-caps ($RUT) are leading the market lower since mid September... Read More
Don't Ignore This Chart! October 08, 2012 at 05:24 PM
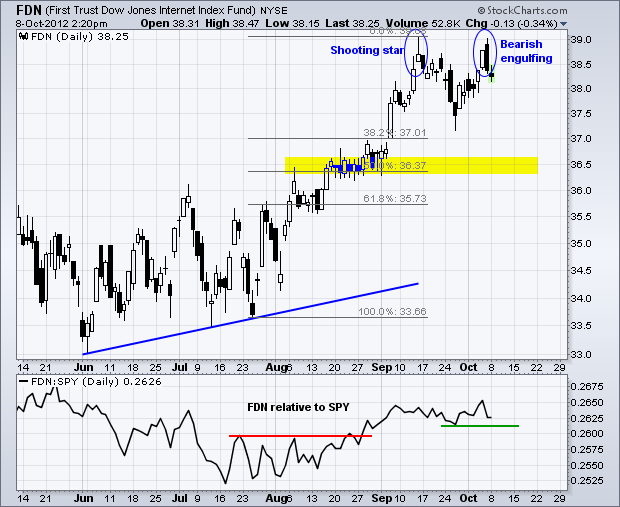
The FirstTrust Internet ETF (FDN) peaked in mid September with a shooting star candlestick. After dipping below 37.50, the ETF bounced back to this peak and formed a bearish engulfing last week. These two affirm resistance at 39... Read More
Don't Ignore This Chart! October 05, 2012 at 03:10 PM
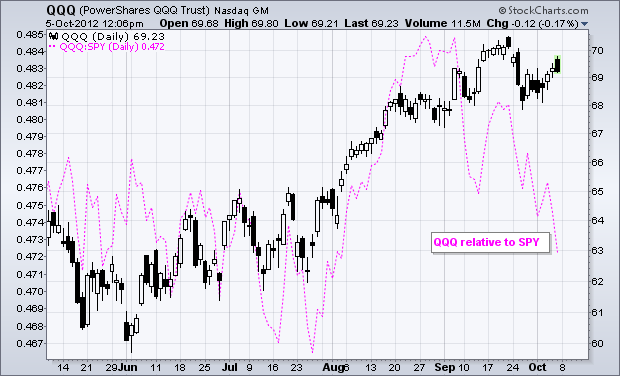
The Nasdaq 100 ETF (QQQ) is up since late August, but the price relative is down. The price relative is the QQQ:SPY ratio, which measures relative performance. This ratio peaked in late August and moved sharply lower the last 5-6 weeks... Read More
Don't Ignore This Chart! October 04, 2012 at 02:10 PM
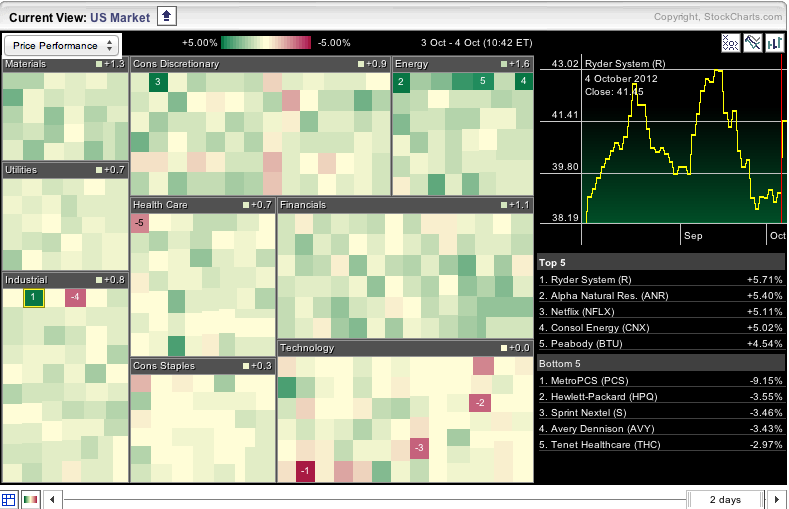
The Sector Market Carpet shows the Energy SPDR (XLE) and the Finance SPDR (XLF) with the most green. The average energy stock is up 1.6% and the average finance stock is up 1.1%. XLE is getting an oversold bounce after Wednesday's decline... Read More
Don't Ignore This Chart! October 03, 2012 at 11:32 AM
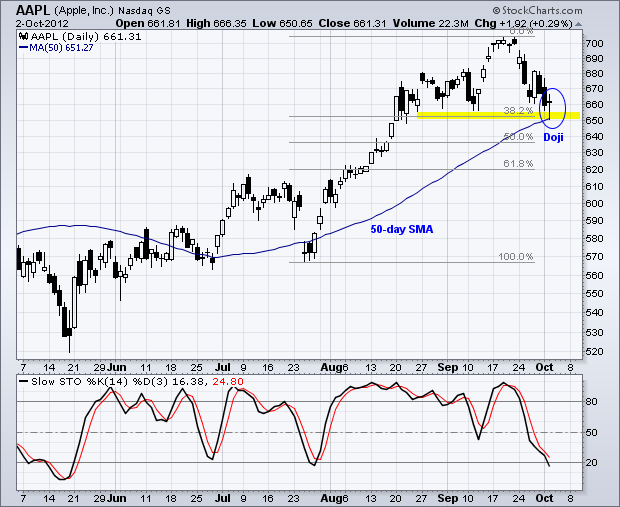
After hitting a new high above 700 in mid September, Apple (AAPL) gapped down and declined to around 660. Three items mark support in this area. The early September low, the 38.2% retracement and the rising 50-day moving average... Read More
Don't Ignore This Chart! October 01, 2012 at 01:25 PM
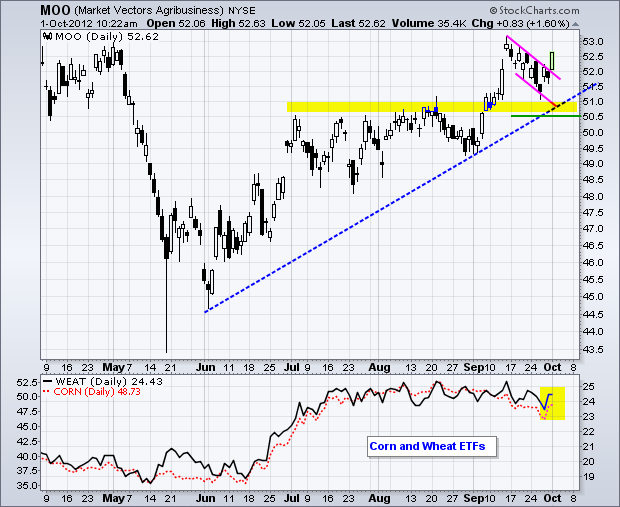
The Agribusiness ETF (MOO) surged over the last three days and broke falling flag resistance. The flag breakout is bullish as long as it holds. Broken resistance and the June trend line mark support at 50.50... Read More