Don't Ignore This Chart! November 30, 2012 at 01:47 PM
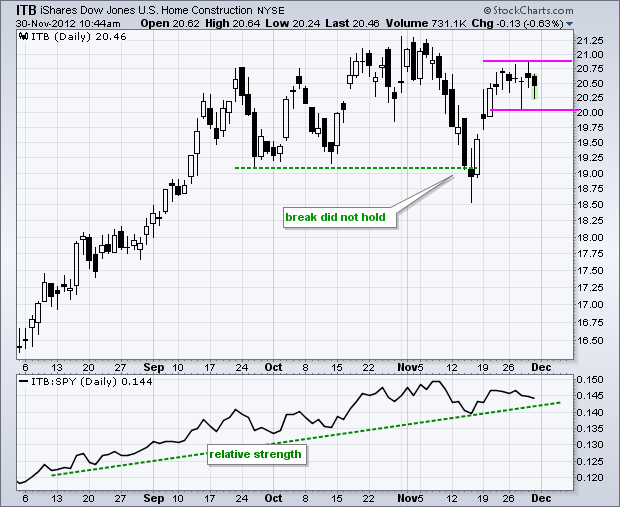
The Home Construction iShares broke below support in mid November, but this break did not hold as the ETF quickly surged back above 20. A flat consolidation has since formed and traders should watch these boundaries for the next directional clue... Read More
Don't Ignore This Chart! November 29, 2012 at 10:28 AM
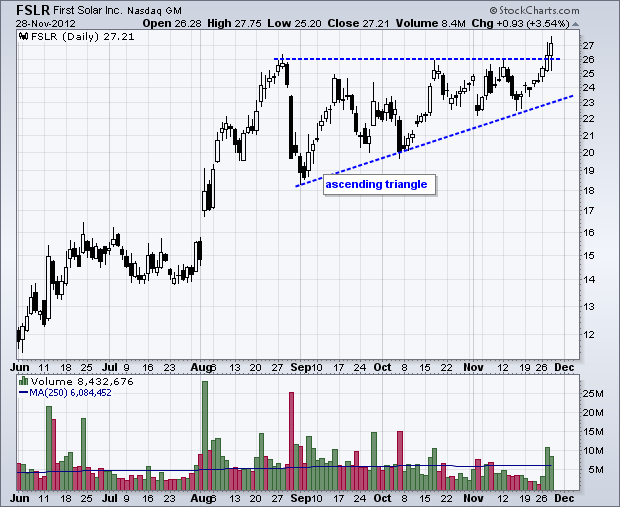
First Solar (FSLR) is leading solar stocks with an ascending triangle breakout on expanding volume. As a bullish continuation pattern, the breakout signals a continuation of the prior advance and targets a move to the low 30s... Read More
Don't Ignore This Chart! November 28, 2012 at 06:15 PM
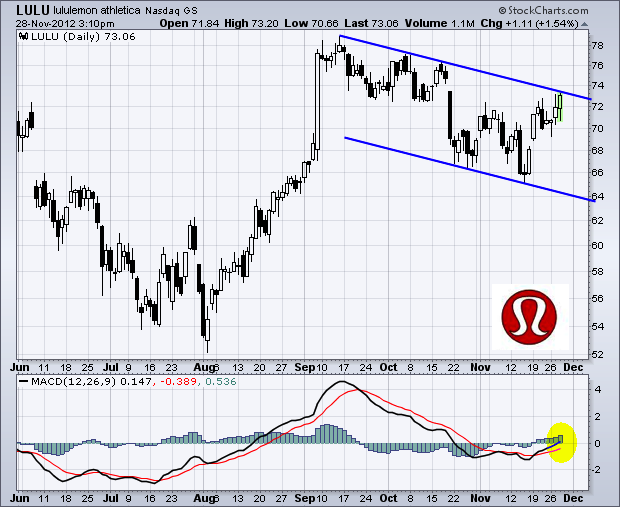
Momentum is improving for lululemon (LULU) as MACD turned positive for the first time since late October. On the price chart, the stock is challenging the upper trend line of a falling channel... Read More
Don't Ignore This Chart! November 27, 2012 at 03:34 PM
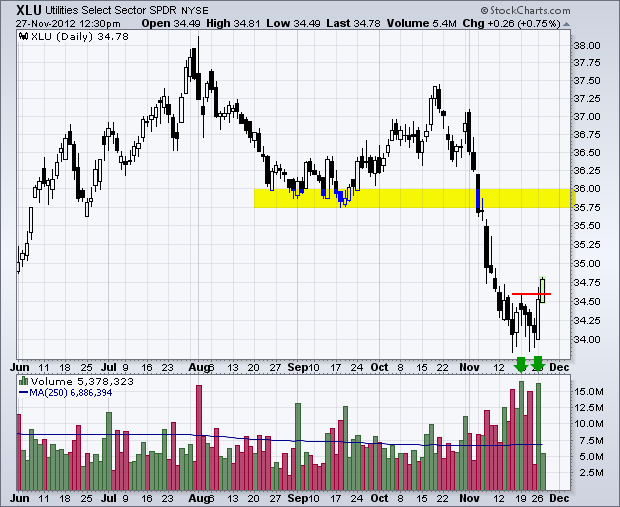
After a sharp decline the first half of November, the Utilities SPDR (XLU) firmed for two weeks and then surged above its first resistance level. Notice that upside volume also surged twice in the last six days. Broken support turns next resistance in the 35.75-36 area... Read More
Don't Ignore This Chart! November 23, 2012 at 09:22 AM
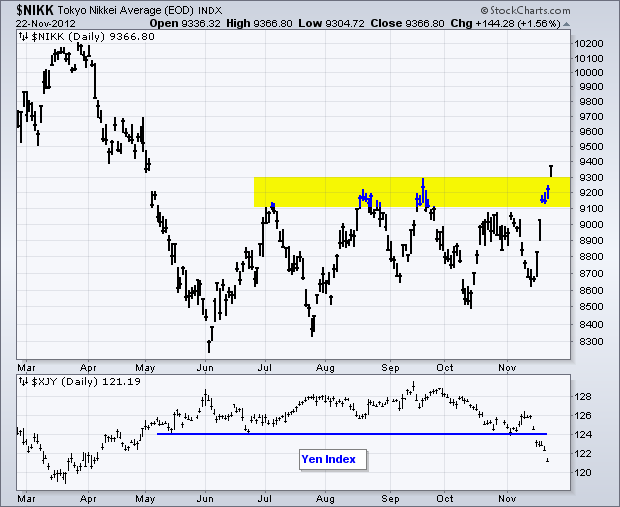
The Nikkei 225 ($NIKK) is getting a boost from weakness in the yen. Notice that the index broke resistance as the Yen Index ($XJY) broke support. The Nikkei benefits because a weaker Yen makes Japanese exports more competitive and this helps the overall economy... Read More
Don't Ignore This Chart! November 21, 2012 at 09:06 PM
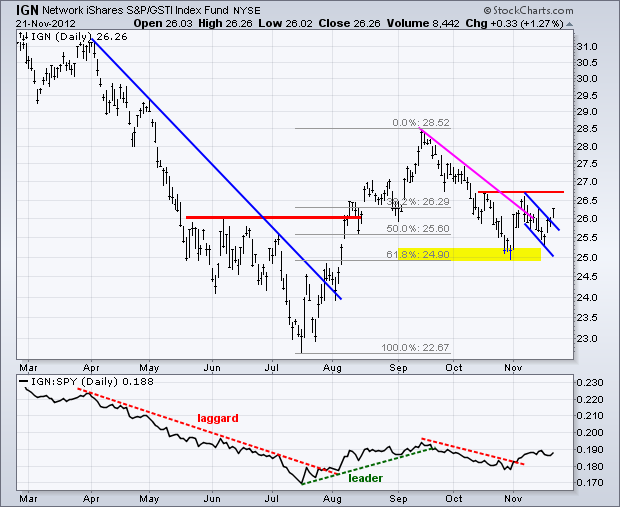
The Networking iShares (IGN) is showing some buying pressure with a flag breakout over the last four days. The ETF broke the September trendline in early November, pulled back with a flag and then broke the flag trendline... Read More
Don't Ignore This Chart! November 20, 2012 at 02:52 PM
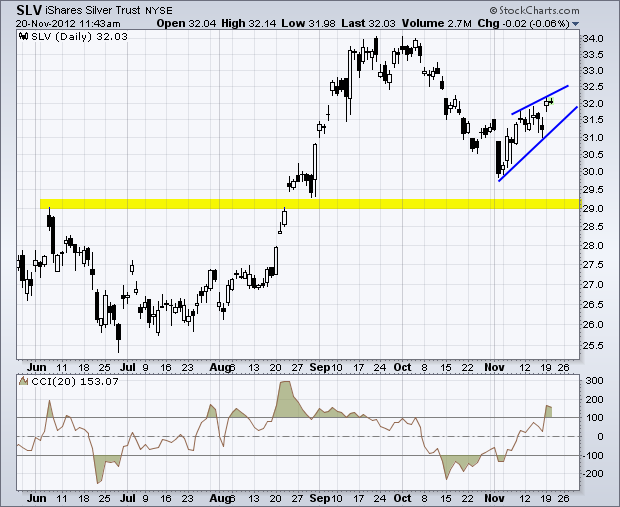
The Silver ETF moved sharply lower in October and then bounced with a rising wedge. The wedge is still rising, but broken support turns resistance in the 32.5 area. A wedge break would signal a continuation lower and target a move to next support in the 29 area... Read More
Don't Ignore This Chart! November 19, 2012 at 06:01 PM
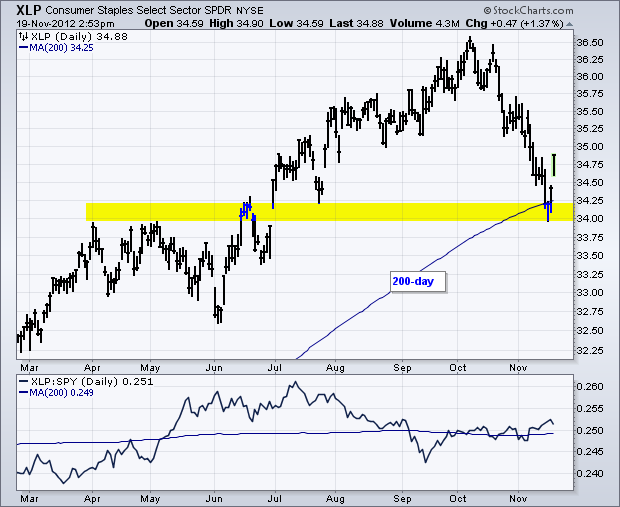
Stocks found a bid on Monday as the Consumer Staples SPDR (XLP) continued its bounce off the rising 200-day moving average. Notice that XLP hit this moving average on Wednesday, firmed on Thursday and bounced on Friday. Today's follow through confirms support in the 34 area... Read More
Don't Ignore This Chart! November 16, 2012 at 03:25 PM
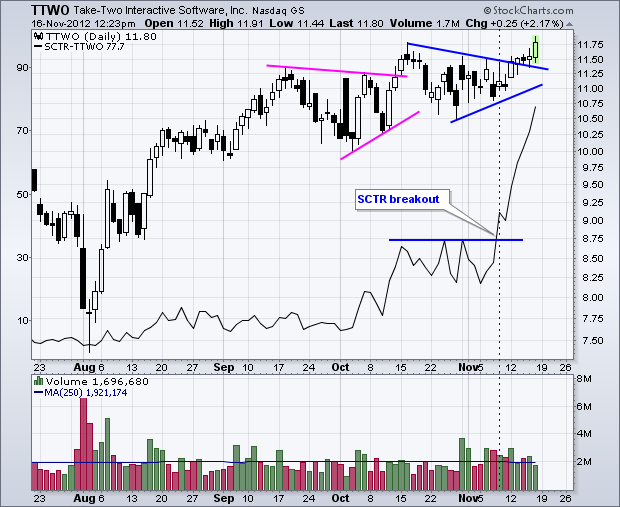
Take-Two Interactive ($TTWO) is showing relative strength with a triangle break earlier this week and break above its October highs today. Notice that the StockCharts Technical Rank (SCTR) broke out just before the triangle break and surged above 70 this week... Read More
Don't Ignore This Chart! November 15, 2012 at 02:56 PM
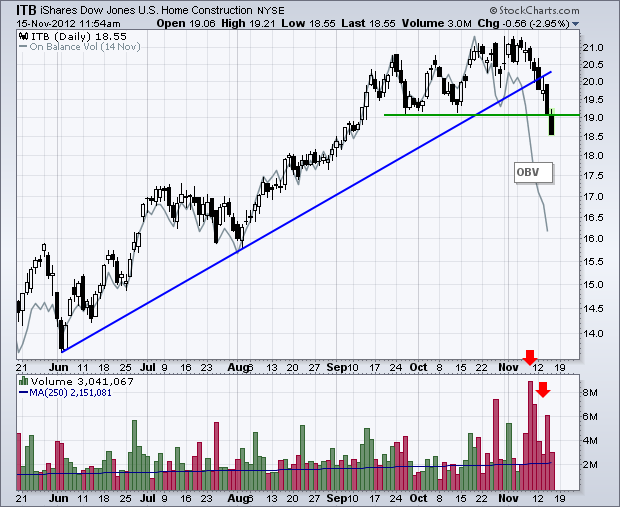
The Home Construction iShares (ITB) failed to hold its break above 21 and plunged over the last eight days. Volume expanded as the ETF broke the October lows. Notice that On Balance Volume (OBV) peaked a week ahead of the ETF and then moved to its lowest level since early August... Read More
Don't Ignore This Chart! November 14, 2012 at 06:12 PM
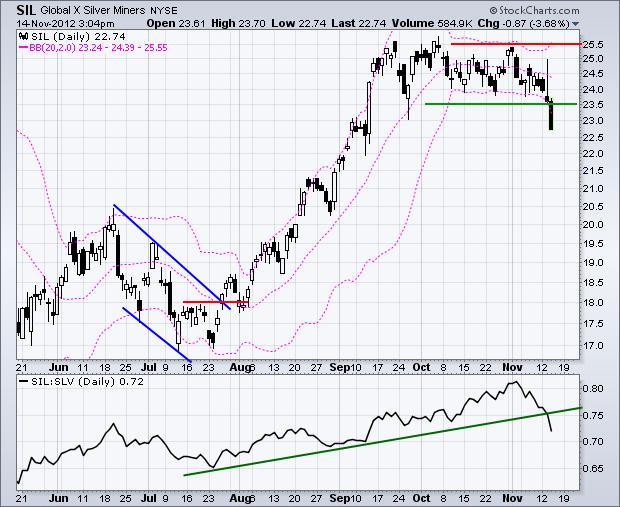
The Silver Miners ETF (SIL) moved into a tight trading range in October and then broke support with a sharp decline the last four days. This move pushed prices below the lower Bollinger band as volatility expanded... Read More
Don't Ignore This Chart! November 13, 2012 at 07:35 PM
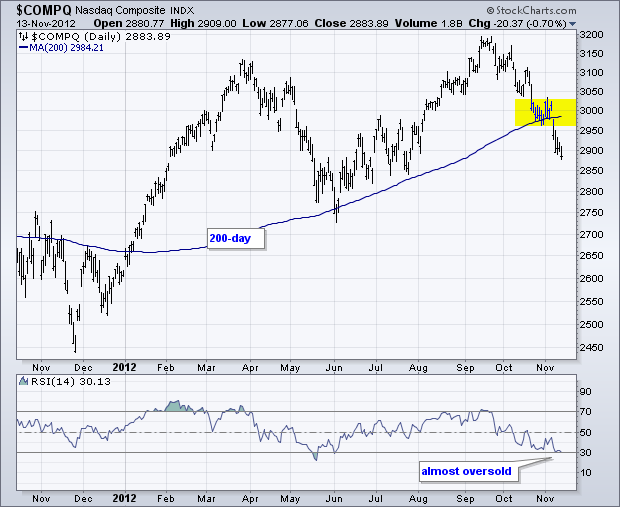
The Nasdaq broke below the 200-day moving average with a gap down last week, and remains below this key level. This moving average and the small consolidation now turn into first resistance. Notice that RSI is almost at oversold levels (below 30)... Read More
Don't Ignore This Chart! November 12, 2012 at 03:38 PM
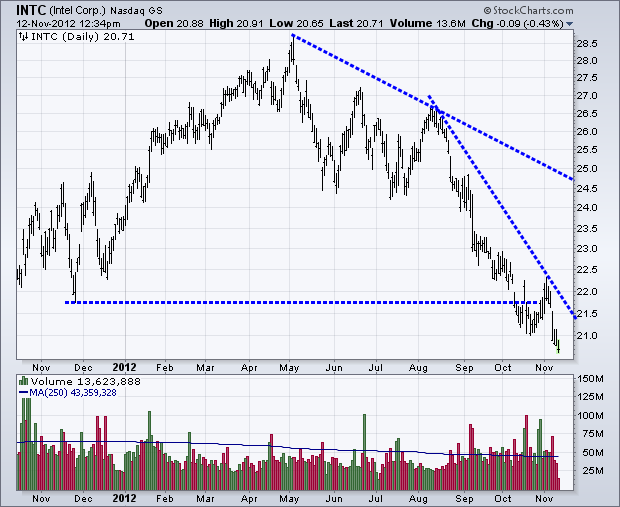
The number of new 52-week lows surged above 90 for the NYSE and Nasdaq (combined). This compares to fewer than 50 new 52-week highs. Selling pressure is taking its toll the last few weeks. Of note, semiconductor powerhouse Intel (INTC) graced the new low list today... Read More
Don't Ignore This Chart! November 09, 2012 at 03:13 PM
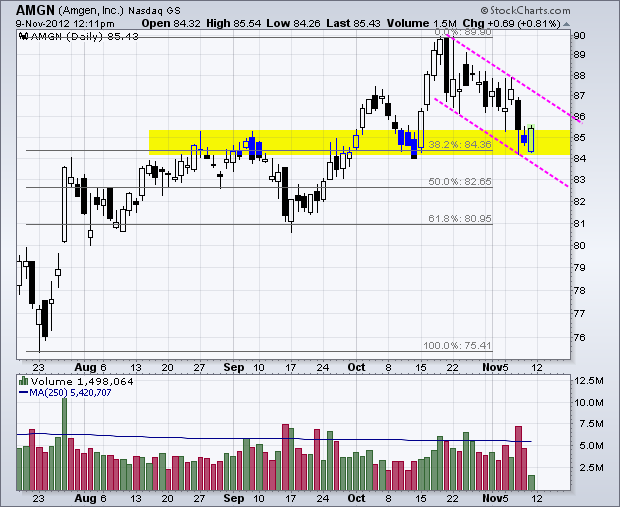
The intraday bullish engulfing scan was quite full around 12PM ET with over 200 stocks making the cut. Among them, Amgen (AMGN) formed a bullish engulfing near the mid October low and 38.2% retracement... Read More
Don't Ignore This Chart! November 08, 2012 at 03:13 PM
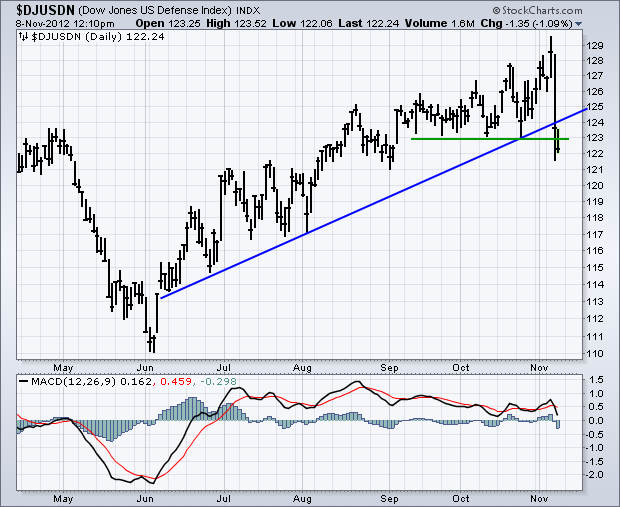
The Dow Jones Defense Index ($DJUSDN) plunged on Wednesday and broke support with further weakness on Thursday. This move reverses a five month uptrend. MACD also moved lower and is on the verge of turning negative for the first time since mid June... Read More
Don't Ignore This Chart! November 07, 2012 at 06:21 PM
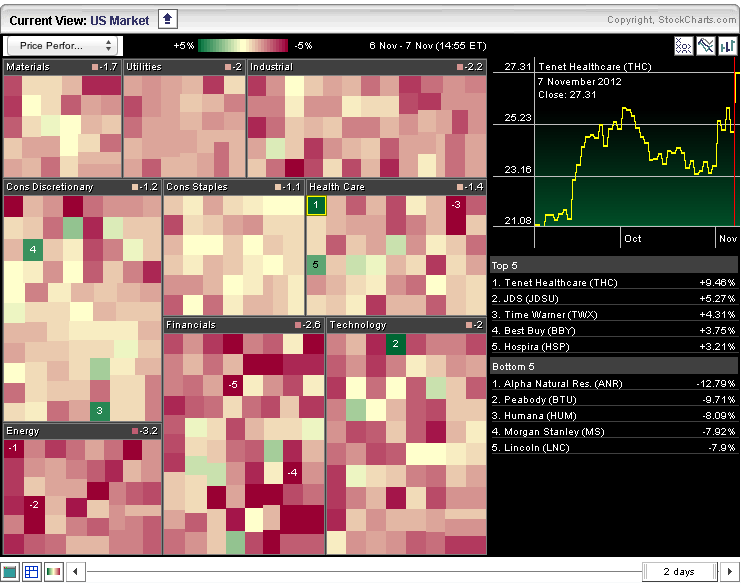
There are not many gainers today, but a few can be found on the Sector Market Carpet. The isolated green boxes show the stocks bucking the selling pressure... Read More
Don't Ignore This Chart! November 06, 2012 at 03:05 PM
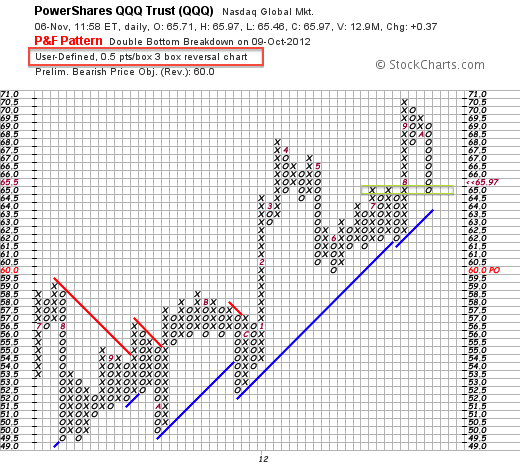
Even though the 50-cent P&F chart for QQQ sport a double bottom breakdown, the overall trend is up because QQQ remains above the Bullish Support Line (blue). Also notice that the ETF is hitting support from broken resistance at 65. The moment-of-truth is here for QQQ... Read More
Don't Ignore This Chart! November 05, 2012 at 04:45 PM
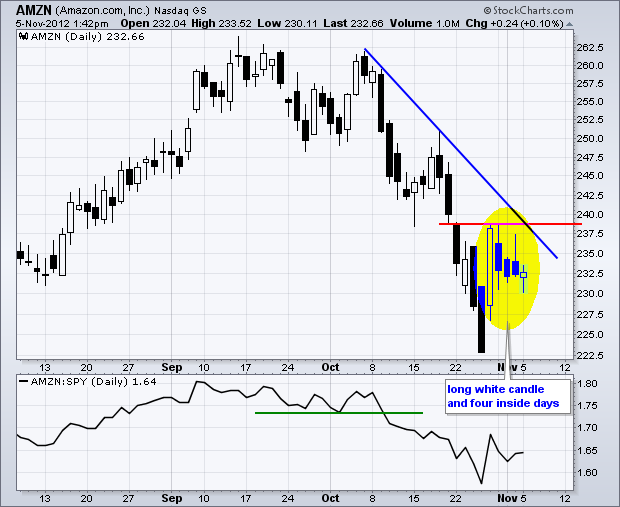
Amazon.com surged with a long white candlestick last week and then stalled the next four days. Notice that these four candlesticks are all within the range of the long white candlestick. These inside days reflect a consolidation... Read More
Don't Ignore This Chart! November 02, 2012 at 03:29 PM
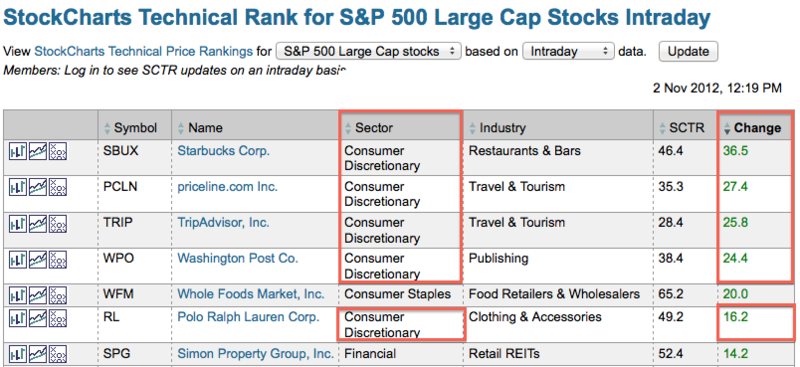
The Consumer Discretionary SPDR (XLY) is getting a boost on Friday from several big moves within the sector. As the StockCharts Technical Rank (SCTR) table shows, the top four SCTR gains come from the consumer discretionary sector... Read More
Don't Ignore This Chart! November 01, 2012 at 04:51 PM
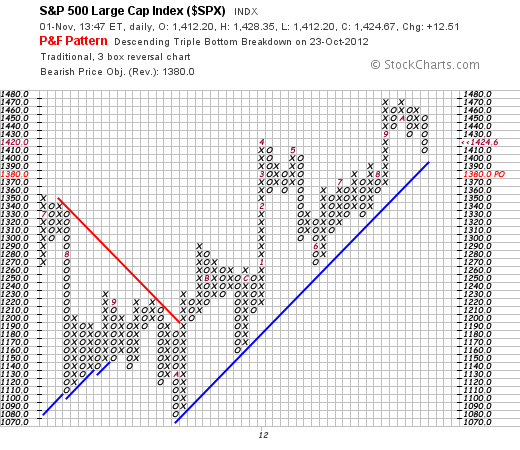
The S&P 500 declined sharply in October, but caught a bid on November 1st and held above the Bullish Support Line. This line has held since October 2011 and represents a one year uptrend. A move below this trend line would signal a reversal... Read More