Don't Ignore This Chart! December 31, 2012 at 11:57 AM
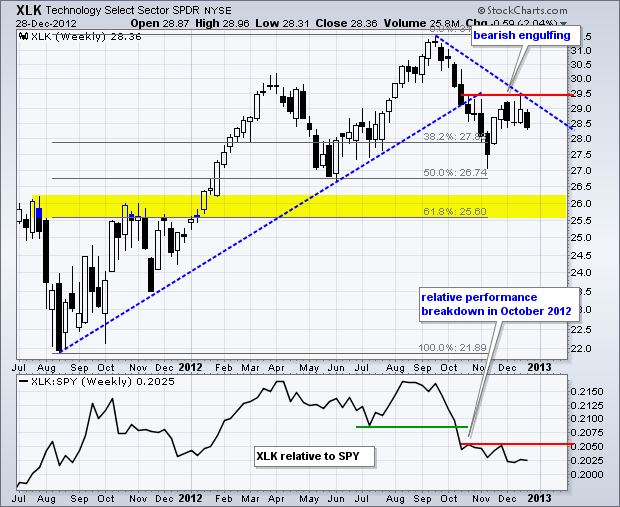
The Technology SPDR (XLK) led the market in the first half of the year, but lagged the market in the second half and underperformed the S&P 500. The technology sector accounts for over 19% of the S&P 500 ETF (SPY) and is by far the biggest sector... Read More
Don't Ignore This Chart! December 30, 2012 at 02:36 PM
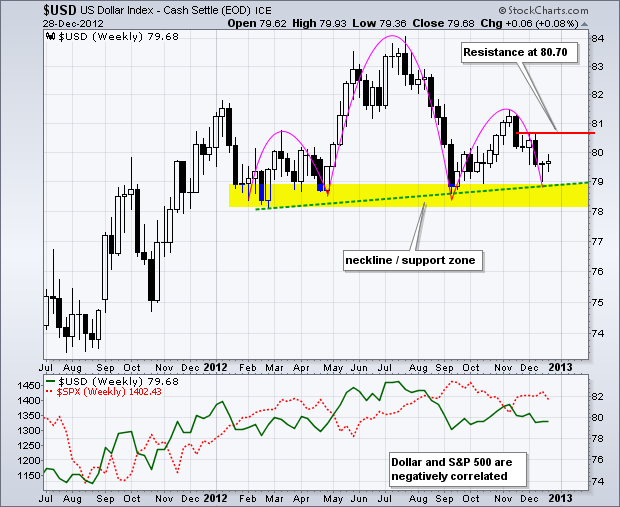
The US Dollar Index ($USD) was all over the place in 2012, but ended the year slightly lower than where it started. The index started the year around 80, surged to 84 and closed at 79.62 on Friday... Read More
Don't Ignore This Chart! December 29, 2012 at 03:17 PM
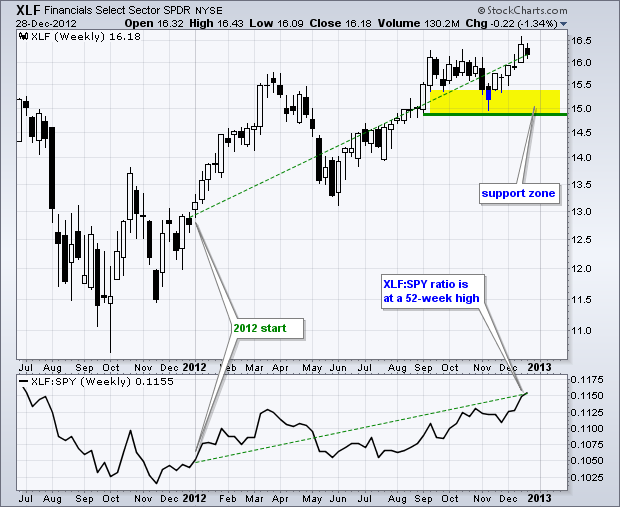
Big banks came to life in 2012 as the Finance SPDR (XLF) started the year strong and ended strong. XLK opened 2012 just above 13 and is likely to finish near a 52-week high. The ETF scored a 52-week high with the move above 16.5 in mid January and is currently around 16.18... Read More
Don't Ignore This Chart! December 28, 2012 at 02:39 PM
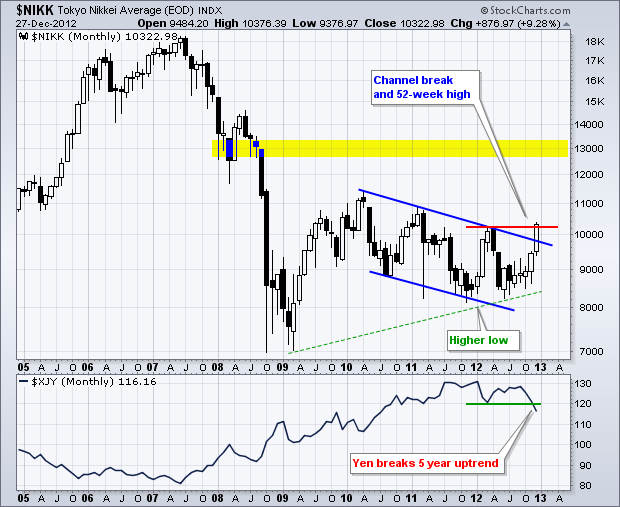
The Nikkei 225 ($NIKK) came to life over the last two months and surged above its March high with a massive surge. Notice that the index held above its 2009 lows and also broke channel resistance in the process... Read More
Don't Ignore This Chart! December 27, 2012 at 02:29 PM
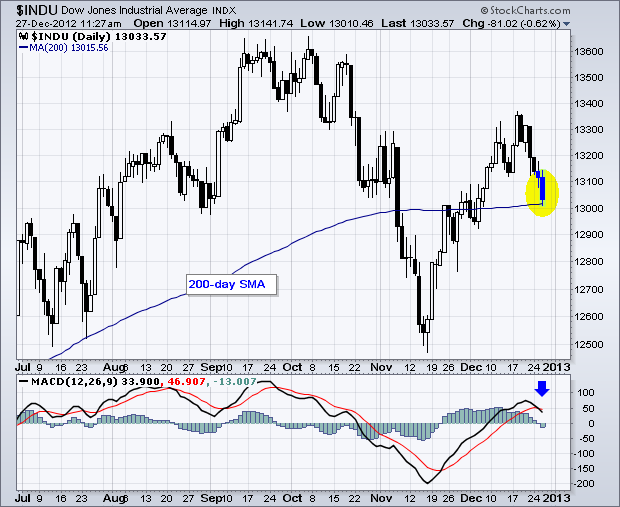
The Dow has fallen over 300 points in the last six trading days and is now testing the 200-day moving average. The senior Average broke above this key average in early December and needs to hold the breakout. A break back below 13000 would be quite negative... Read More
Don't Ignore This Chart! December 26, 2012 at 03:22 PM
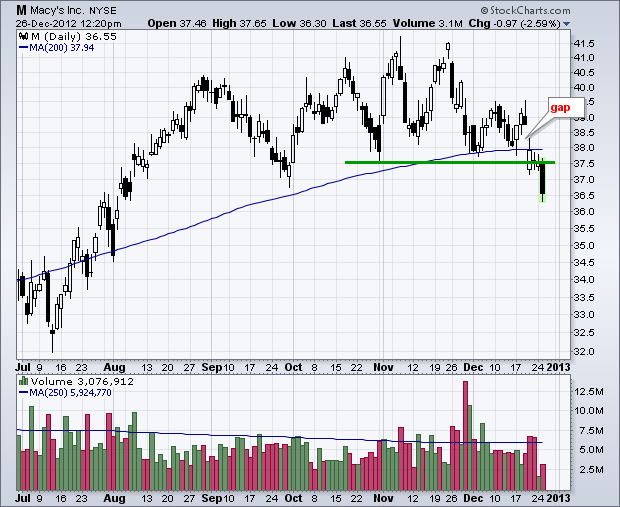
Macy's (M) is having a rough season as the stock broke the 200-day moving average and support at 37.50 the last few days. Also notice that stock gapped down four days ago and fell on high volume just before Christmas. This gap zone becomes the first resistance zone to watch... Read More
Don't Ignore This Chart! December 21, 2012 at 02:50 PM
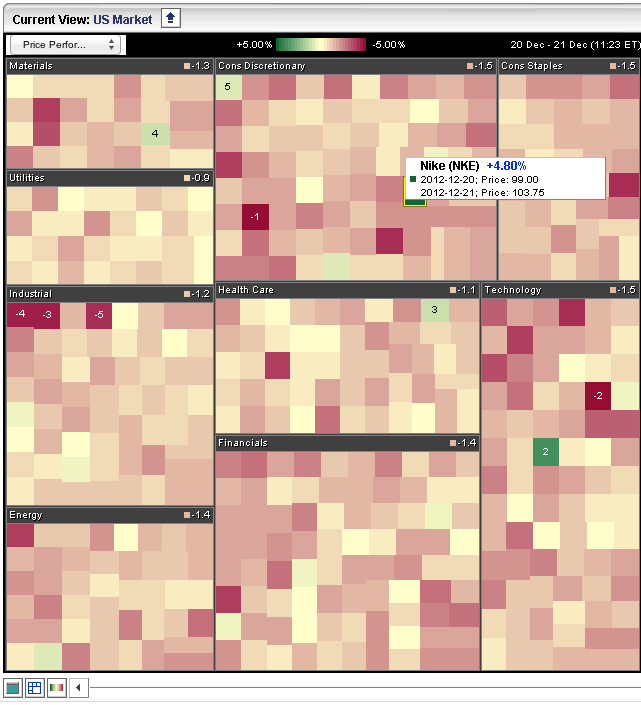
The Sector Market Carpet is full of red today as selling pressure hit an overbought stock market. All sectors are down, but there are a few isolated green boxes. Nike (NKE) is the top performer with a 4.8% surge... Read More
Don't Ignore This Chart! December 20, 2012 at 02:51 PM
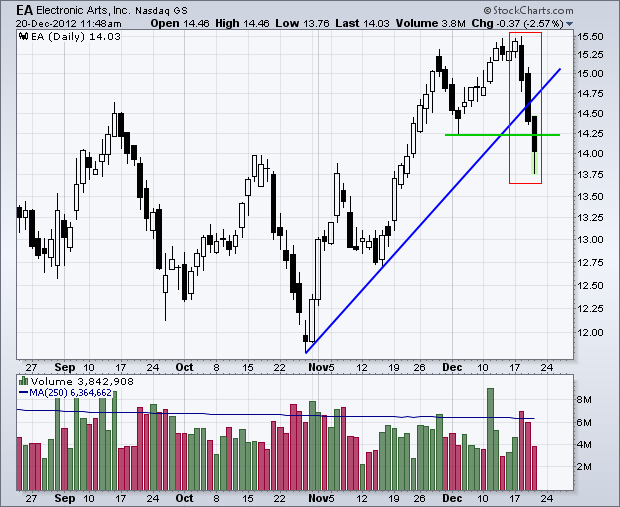
Electronic Arts (EA) came under strong selling pressure the last three days with consecutive long black candlesticks. As this chart now stands (11:48 ET), a bearish three black crows pattern is taking shape... Read More
Don't Ignore This Chart! December 18, 2012 at 02:57 PM
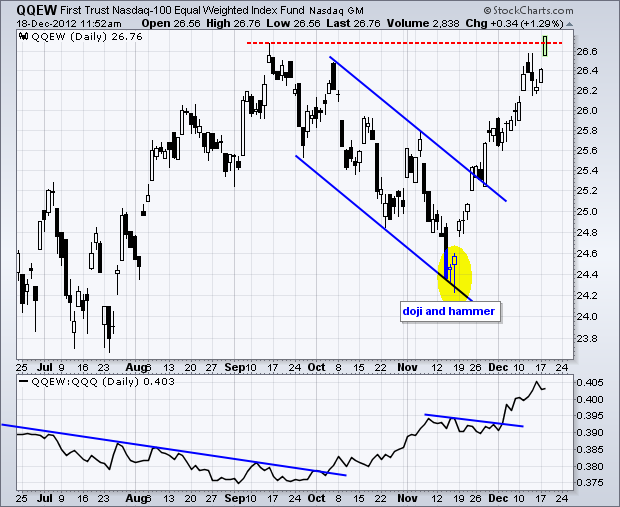
The Nasdaq 100 Equal-Weight ETF (QQEW) continues to lead the Nasdaq 100 ETF (QQQ) with a break above its autumn highs. After forming a doji and a hammer, QQEW broke channel resistance in late November and never looked back... Read More
Don't Ignore This Chart! December 17, 2012 at 04:36 PM
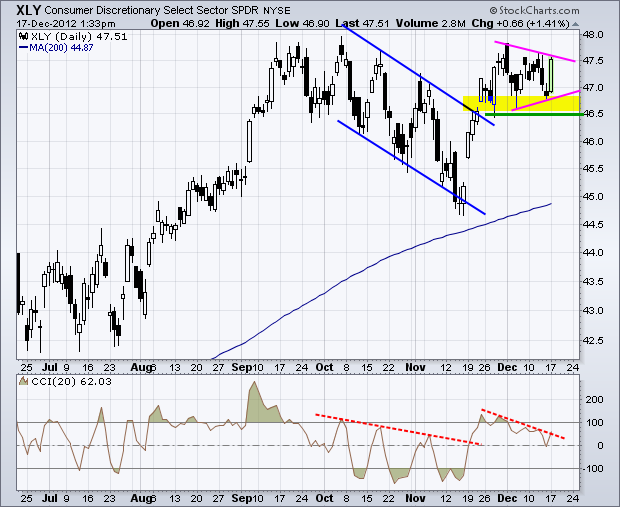
The Consumer Discretionary SPDR (XLY) is showing strength with a channel breakout in November and a pennant consolidation in December. XLY surged over 1.4% on Monday to form the second low for the pennant. A breakout would signal a continuation higher... Read More
Don't Ignore This Chart! December 14, 2012 at 09:28 AM
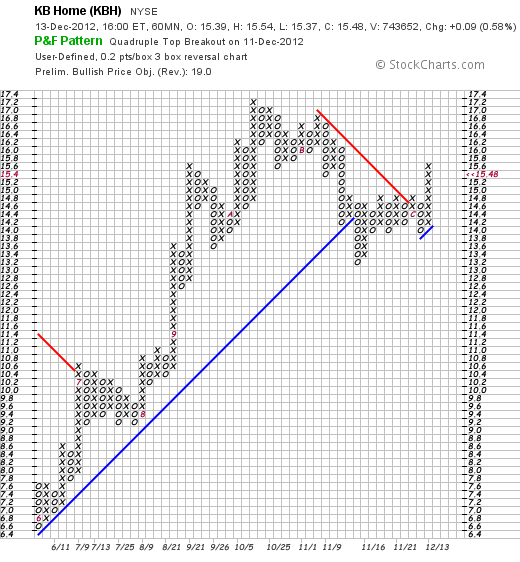
Intraday P&F charts are good for capturing short-term and medium-term price movements. The chart below is a 60-minute P&F chart for KB Home (KBH). Notice how the stock broke the Bearish Resistance Line and forged a breakout at 15 this week... Read More
Don't Ignore This Chart! December 13, 2012 at 02:04 PM
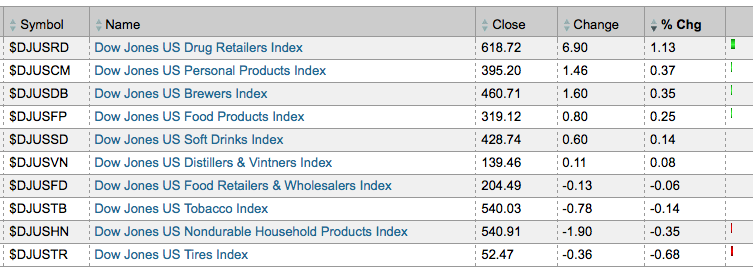
With the consumer staples sector showing some relative strength on Thursday, I went to the sector summary to find the strong industry groups within this sector. The image below shows the 10 industry groups with the DJ US Drug Retailers Index ($DJUSRD) leading the way... Read More
Don't Ignore This Chart! December 12, 2012 at 02:38 PM
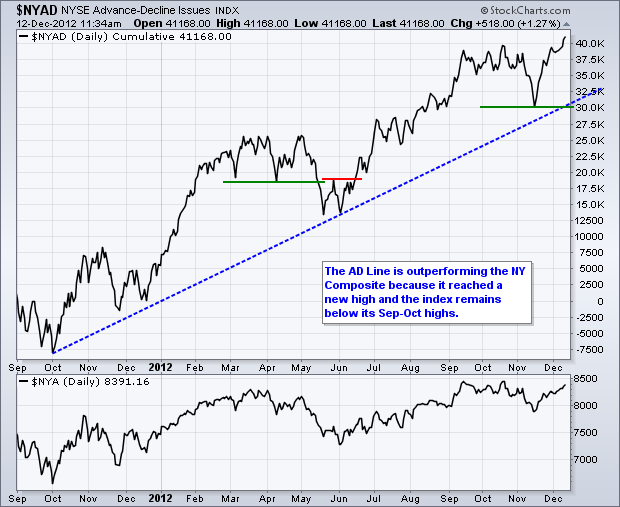
The NYSE AD Line ($NYAD) reflects broad market strength with a move above the September-October highs this week. In fact, the indicator is trading at a 52-week high. There are no signs of weakness here... Read More
Don't Ignore This Chart! December 11, 2012 at 02:10 PM
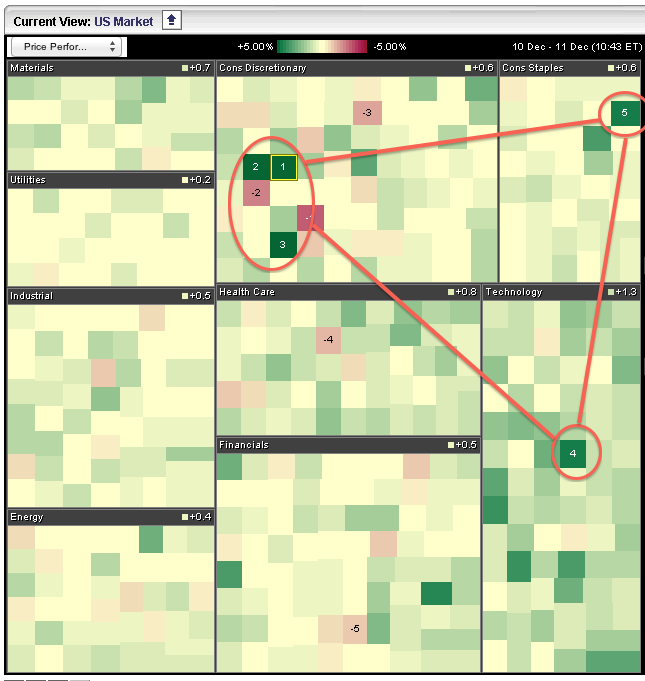
The technology sector is showing upside leadership with the average stock gaining 1.3% on Tuesday. The red ovals highlight the top five stocks in the S&P 500 today... Read More
Don't Ignore This Chart! December 10, 2012 at 03:16 PM
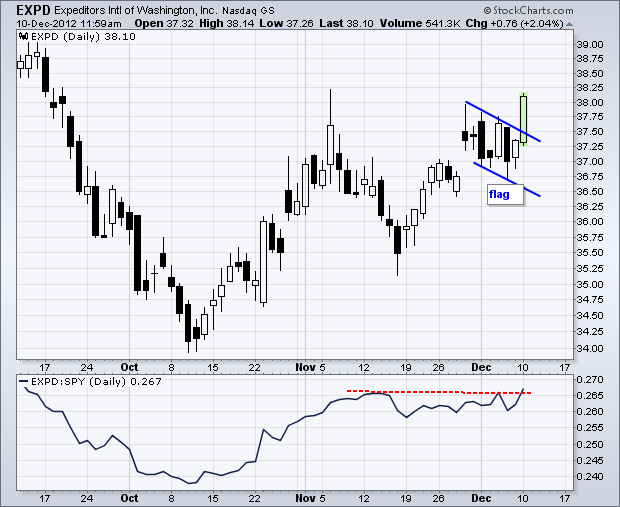
After a surge from mid to late November, Expeditors International (EXPD) hit resistance from the early November high around 38. A falling flag formed into early December and the stock broke flag resistance with a surge above 38 on Monday... Read More
Don't Ignore This Chart! December 07, 2012 at 11:46 AM
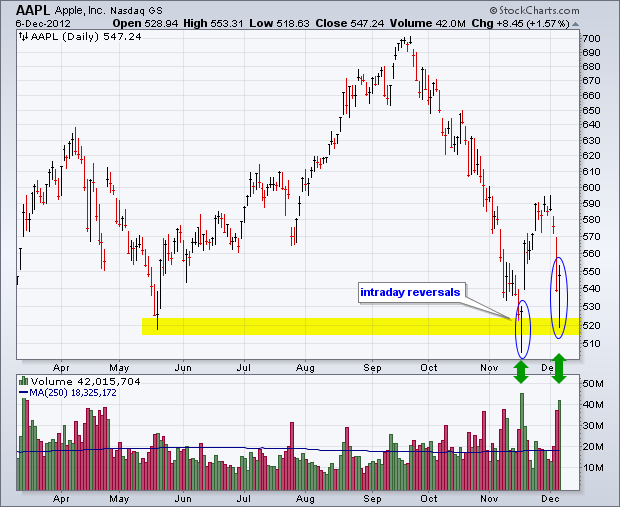
Apple (AAPL) tested its mid November low and long-term support with a dip below 520 on Thursday. Support in the 520 area extends back to the May low. Notice how the stock forged an intraday reversal for the second time in two months... Read More
Don't Ignore This Chart! December 06, 2012 at 03:00 PM
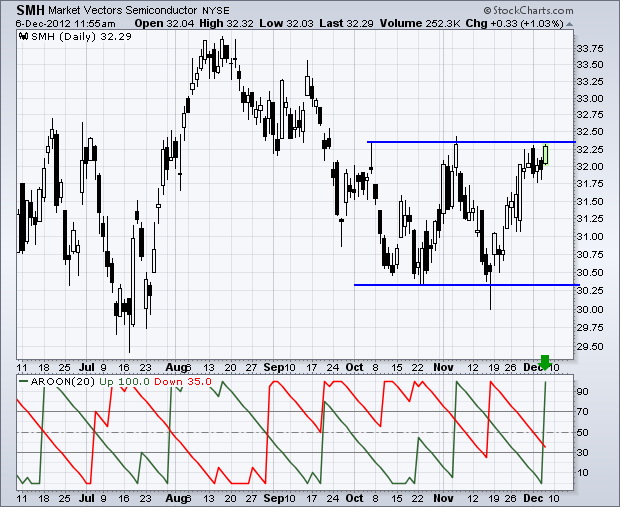
The Market Vectors Semiconductor ETF (SMH) is challenging resistance with a big surge over the last few weeks. Aroon confirms strength as Aroon Up (green) moved above Aroon Down (red) and hit the +100 level. This sometimes signals the start of a new trend... Read More
Don't Ignore This Chart! December 05, 2012 at 05:54 PM
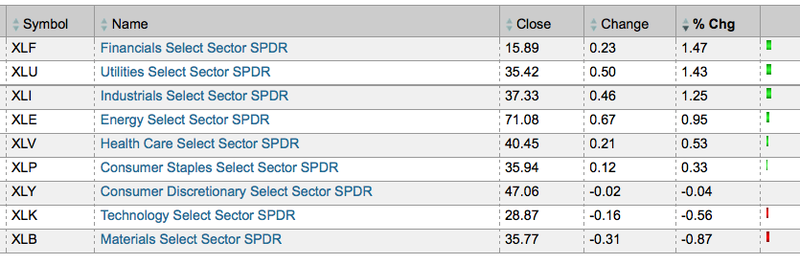
Acheck on the sector summary shows the finance, industrials and utilities sectors leading the market on Wednesday afternoon with 1+ percent gains. Users can click on the sector names to drill down and see which industry groups are leading and lagging within the sector... Read More
Don't Ignore This Chart! December 04, 2012 at 06:54 PM
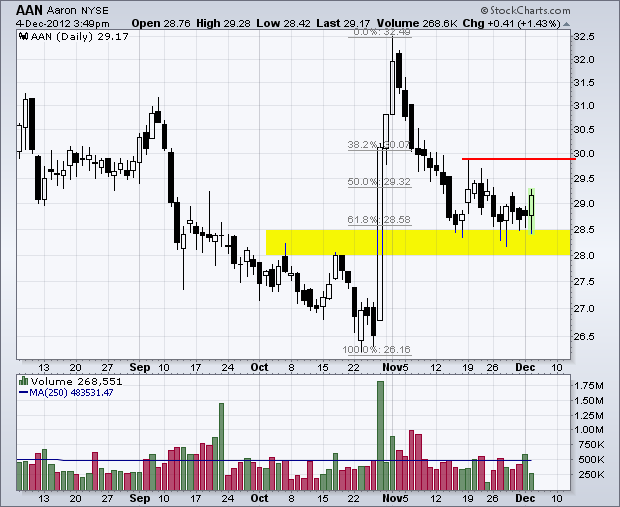
Aaron (AAN) surged above 32 and then fell all the way back below 29. Even though this decline looks excessive, note that it retraced 62% of the prior decline and the stock firmed near broken resistance. A break above the mid November high on good volume would be bullish... Read More
Don't Ignore This Chart! December 03, 2012 at 01:04 PM
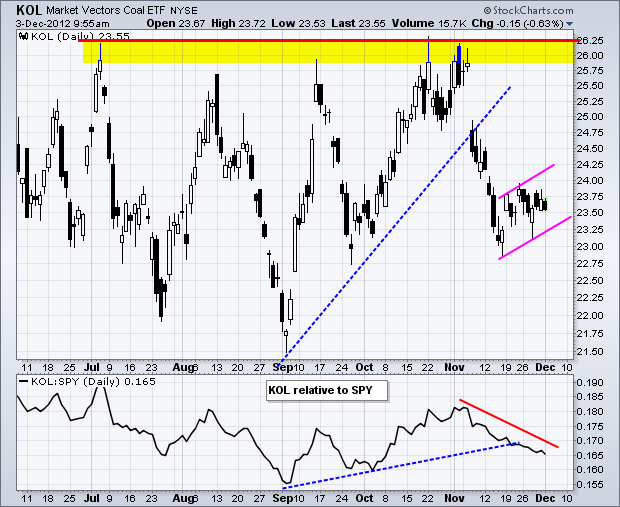
After hitting big resistance in the 26 area, the Coal ETF (KOL) moved sharply lower and then formed a rising flag the last two weeks. These are bearish continuation patterns that typically form after a sharp decline. A move below flag support would signal a continuation lower... Read More