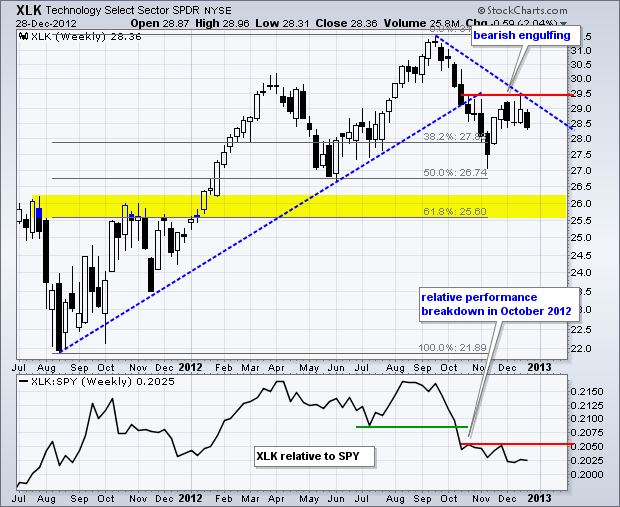
The Technology SPDR (XLK) led the market in the first half of the year, but lagged the market in the second half and
underperformed the S&P 500. The technology sector accounts for over 19% of the S&P 500 ETF (SPY) and is by far the biggest sector. Lack of leadership from this key sector is a concern as we head into 2013. The chart below shows XLK breaking the August 2011 trend line and this break-zone turning into resistance in the 29-29.5 area. This zone marks clear resistance because the ETF failed to hold above 29 at least five times in the last nine weeks. Note that XLK formed a bearish engulfing the first week of December and a black candlestick last week. The base case scenario is for a continuation lower with the next support zone in the 26 area. A break above 29.50 is needed to change this bearish prognosis.

Click this image for a live chart

Click this image for a live chart

About the author:
Arthur Hill, CMT, is the Chief Technical Strategist at TrendInvestorPro.com. Focusing predominantly on US equities and ETFs, his systematic approach of identifying trend, finding signals within the trend, and setting key price levels has made him an esteemed market technician. Arthur has written articles for numerous financial publications including Barrons and Stocks & Commodities Magazine. In addition to his Chartered Market Technician (CMT) designation, he holds an MBA from the Cass Business School at City University in London.
Learn More