Don't Ignore This Chart! January 31, 2013 at 05:55 PM
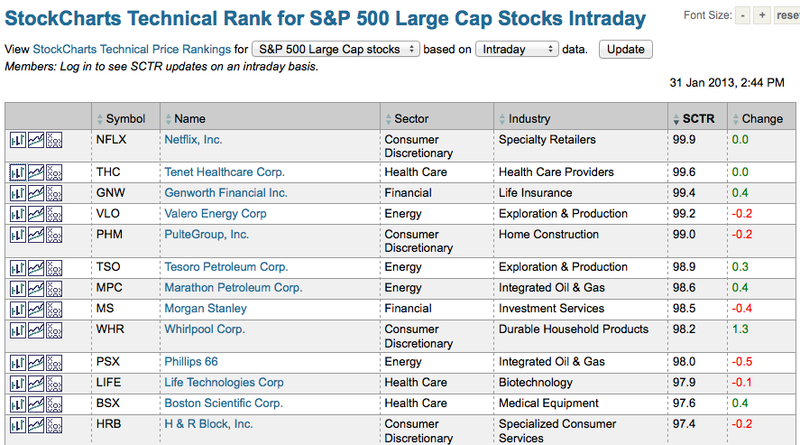
Want to find the leaders in the S&P 500? The StockCharts Technical Rank (SCTR) ranks the 500 S&P stocks from 0 to 100. The top 50 stocks in the index have scores from 90 to 100. These are deemed the stocks with the strongest technicals and many are trading near 52-week high... Read More
Don't Ignore This Chart! January 30, 2013 at 03:11 PM
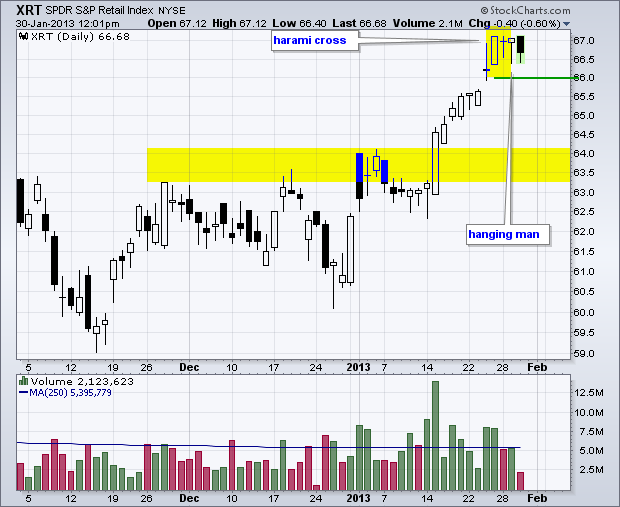
The bigger trends are clearly up for the Retail SPDR (XRT) as the ETF broke resistance with a big surge in January. However, XRT is short-term overbought after a big move and bearish candlesticks are taking shape... Read More
Don't Ignore This Chart! January 29, 2013 at 03:07 PM
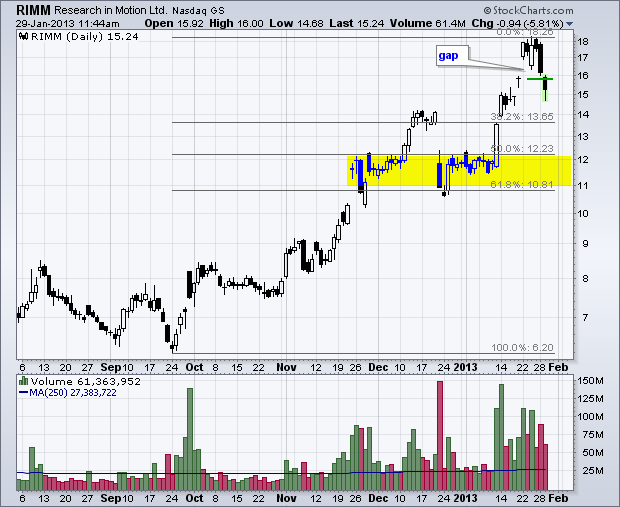
Research in Motion (RIMM) has been one of the best performing stocks since late September. There is, however, evidence that the advance has exhausted itself as RIMM filled last week's gap above 16... Read More
Don't Ignore This Chart! January 28, 2013 at 05:43 PM
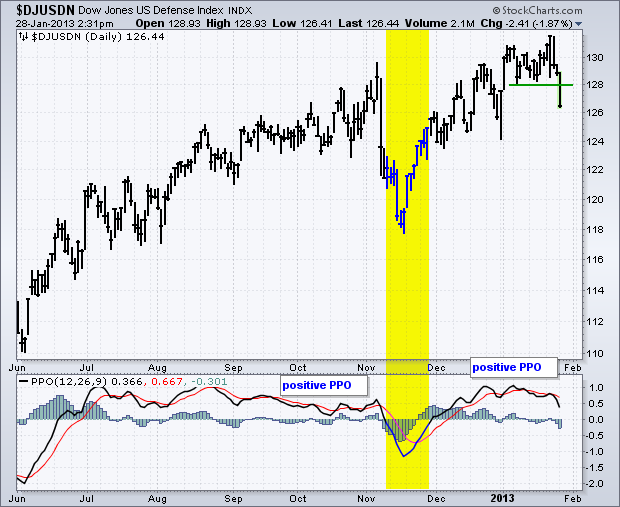
The DJ US Defense Index ($DJUSDN) was hit hard the last three days and broke below the January lows. This index is now down for the year, which means it is underperforming the broader market... Read More
Don't Ignore This Chart! January 25, 2013 at 02:58 PM
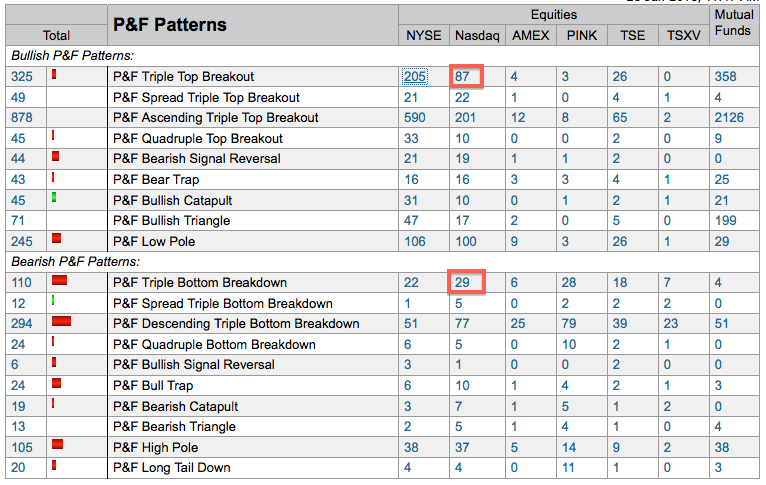
The P&F pattern table on the predefined scans page is a good place to gauge the long-term trend for the stock market... Read More
Don't Ignore This Chart! January 24, 2013 at 04:30 PM
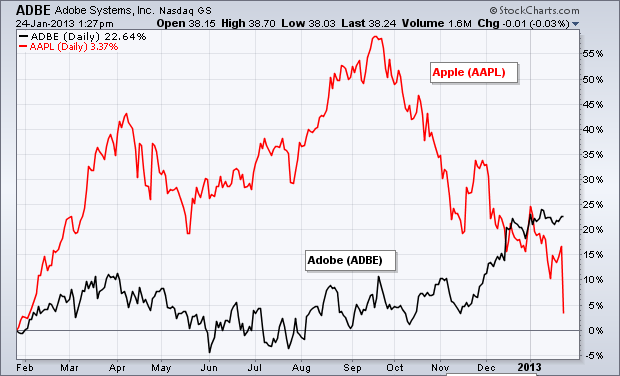
Apple may not support flash on its iPhone and iPad, but that does not seem to bother Adobe (ADBE) shareholders. Adobe lagged Apple throughout 2012, but may be having the last laugh as it starts to outperform... Read More
Don't Ignore This Chart! January 23, 2013 at 05:49 PM
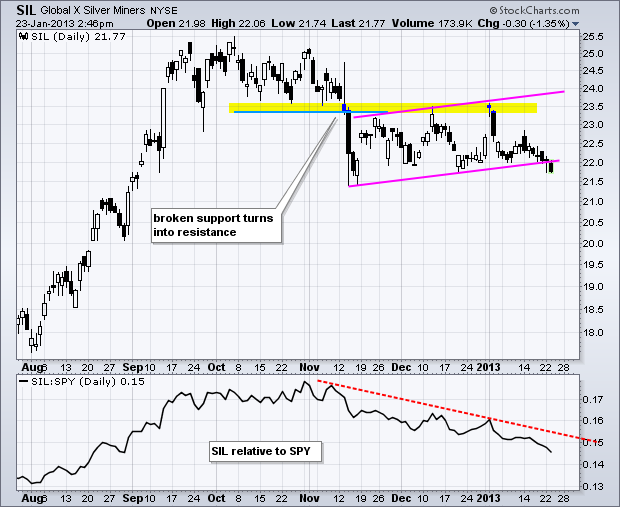
The Silver Miners ETF (SIL) is having a tough time this year with a failed gap and now a move below the early January low. After breaking down in November, the ETF formed a rising channel the last two months... Read More
Don't Ignore This Chart! January 22, 2013 at 06:35 PM
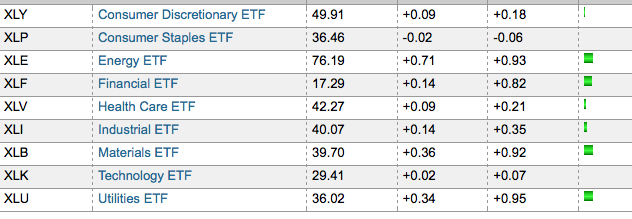
The Utilities SPDR (XLU) is showing some upside leadership on Tuesday with a .95% gain. This makes XLU the top performing sector so far. Energy (XLE), Financials (XLF) and Materials (XLB) are also performing well. You can find more leaders and laggards on the market summary page... Read More
Don't Ignore This Chart! January 18, 2013 at 04:34 PM
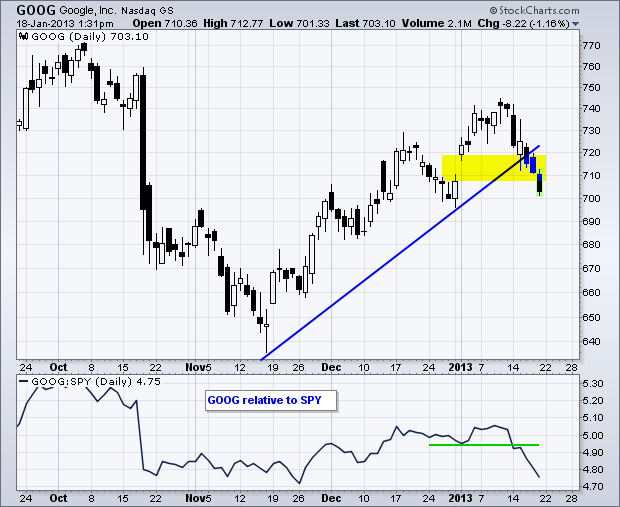
Stocks moved higher this week, but Google (GOOG) did not partake and fell rather sharply. Notice that the stock broke the November trend line and filled the 2-Jan gap. Yes, GOOG is below its 2-Jan open . The price relative (GOOG:SPY ratio) turned down and broke support this week... Read More
Don't Ignore This Chart! January 17, 2013 at 05:23 PM
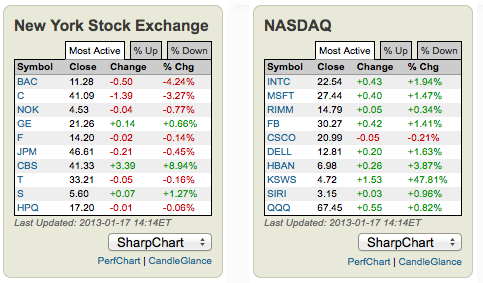
The Dow is up triple digits and close to its Sep-Oct highs, but the NYSE most active list shows more decliners than gainers (7 to 3). Big banks (BAC,C,JPM) are leading the way lower on profit taking... Read More
Don't Ignore This Chart! January 16, 2013 at 03:11 PM
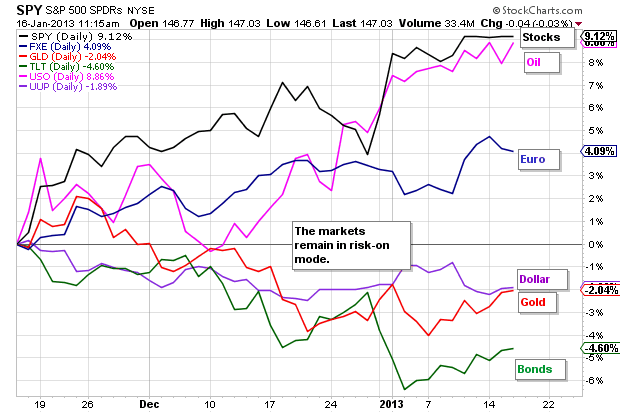
The markets have been in risk-on mode since mid November and continue to embrace risk. The chart below shows the S&P 500 ETF (SPY) and US Oil Fund (USO) performing the best. The 20+ Year T-Bond ETF (TLT) is performing the worst... Read More
Don't Ignore This Chart! January 15, 2013 at 03:02 PM
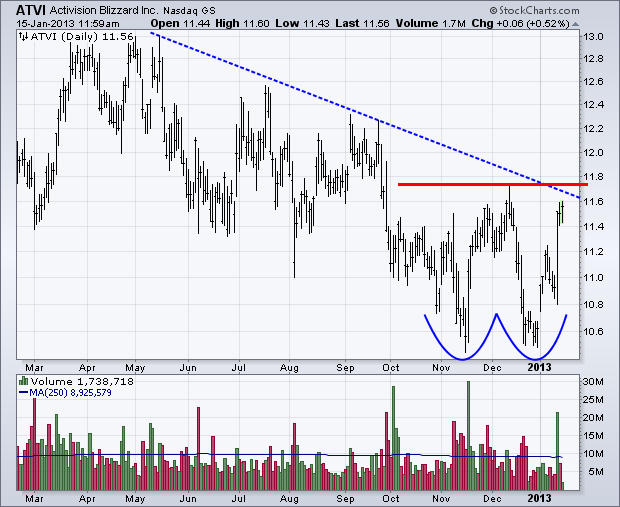
Activision (ATVI) came to life with a gap and high-volume surge off support in 2013. The stock remains in a long-term downtrend, but could be forming a double bottom over the last three months. A break above the December high would confirm the pattern and reverse the downtrend... Read More
Don't Ignore This Chart! January 14, 2013 at 04:38 PM
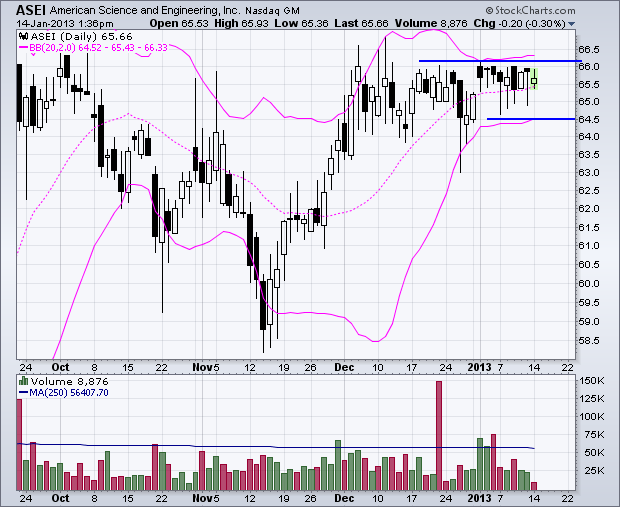
American Science and Engineering (ASEI) surged in November and then moved into a trading range the last six week. Notice that volatility is contracting as the Bollinger Bands narrow. In particular, ASEI traded between 64.5 and 66... Read More
Don't Ignore This Chart! January 11, 2013 at 10:20 AM
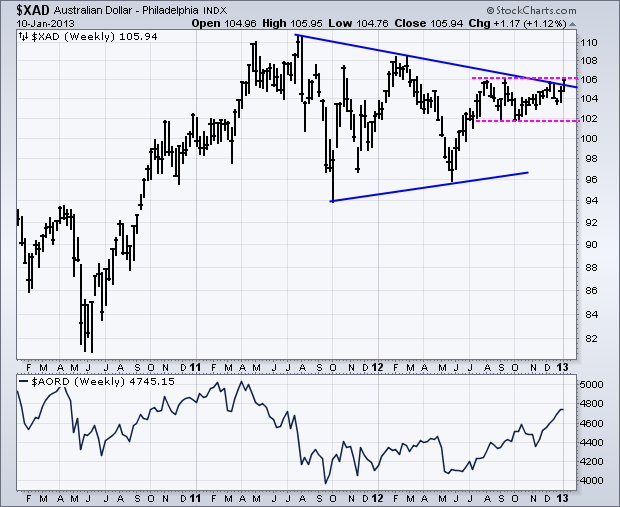
The Australian Dollar Index ($XAD) broke above trend line resistance from a large triangle this week. Medium-term, the index is still trading in a range extending back to July 2012. A break above the July-September highs would argue for a challenge to the 2011 highs... Read More
Don't Ignore This Chart! January 10, 2013 at 02:35 PM
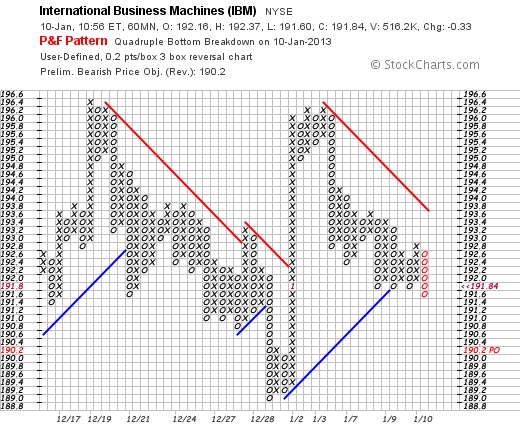
IBM has been underperforming the broader market for several months and continued this trend with a break below support. On the P&F chart, notice how the stock formed three O-Columns with equal lows in January... Read More
Don't Ignore This Chart! January 09, 2013 at 03:16 PM
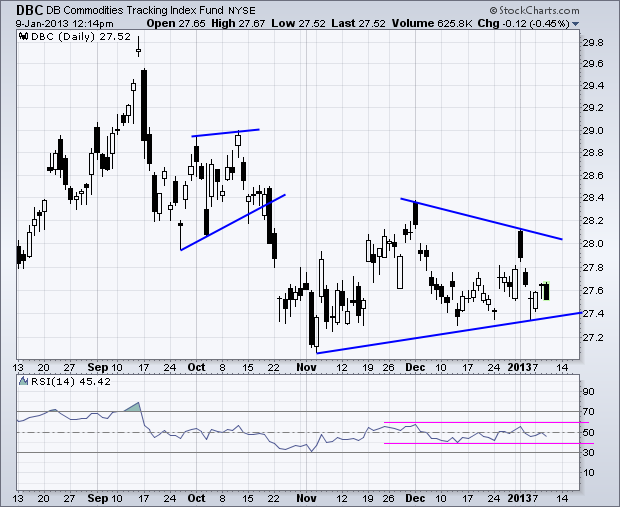
The Commodity Index Fund ($DBC) declined from mid September to early November and then formed a triangle consolidation. After a fall last week, the ETF is testing triangle support and a break below 27.3 would be bearish... Read More
Don't Ignore This Chart! January 08, 2013 at 02:50 PM
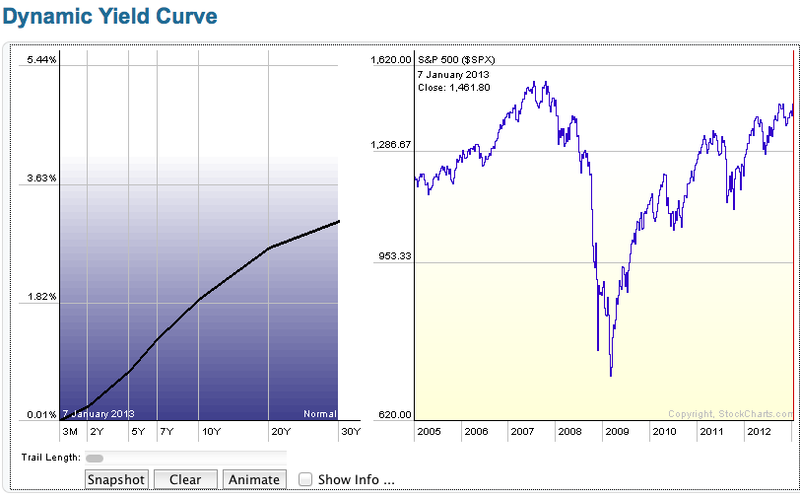
The 10-year Treasury Yield ($TNX) surged over the last two weeks, but remains at relatively low levels historically. Also note that the yield curve is still quite steep with the 2-Year Treasury Yield ($UST2Y) hovering around .27% and the 10-year Treasury Yield near 1.88%... Read More
Don't Ignore This Chart! January 07, 2013 at 03:07 PM
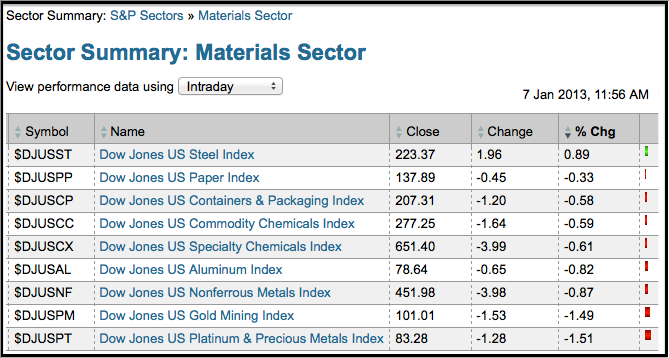
Chartists can find the leaders and the laqgards by sifting through the Sector Summary. This image shows the industry groups within the materials sector. Eight of the nine are down. The DJ US Steel Index ($DJUSST) is the lone gainer as it bucks the market... Read More
Don't Ignore This Chart! January 04, 2013 at 02:13 PM
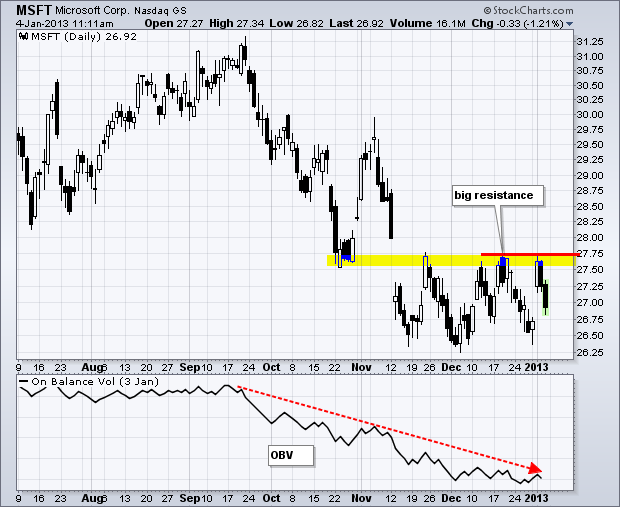
Microsoft (MSFT) is having a tough year already as the stock failed to clear resistance and moved sharply lower the last two days. Resistance at 27.75 stems from broken support and the November-December highs... Read More
Don't Ignore This Chart! January 03, 2013 at 09:02 AM
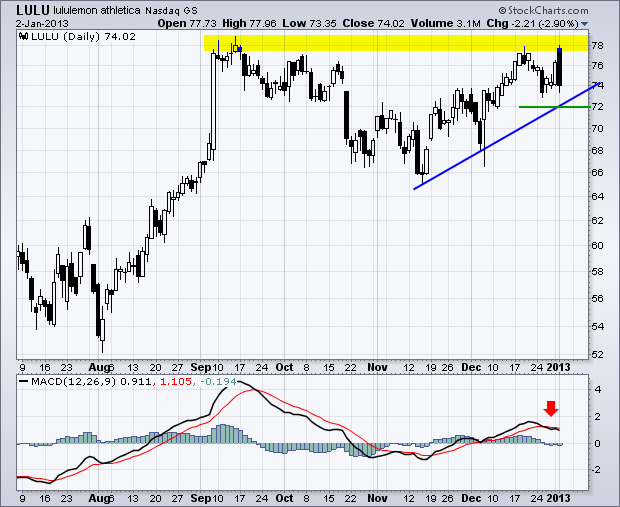
Not all stocks participated in Wednesday's big advance. Lululemon (LULU) started strong, but quickly succumbed to selling pressure and closed sharply lower. With a strong open and weak close, a bearish engulfing pattern formed at resistance... Read More
Don't Ignore This Chart! January 02, 2013 at 03:33 PM
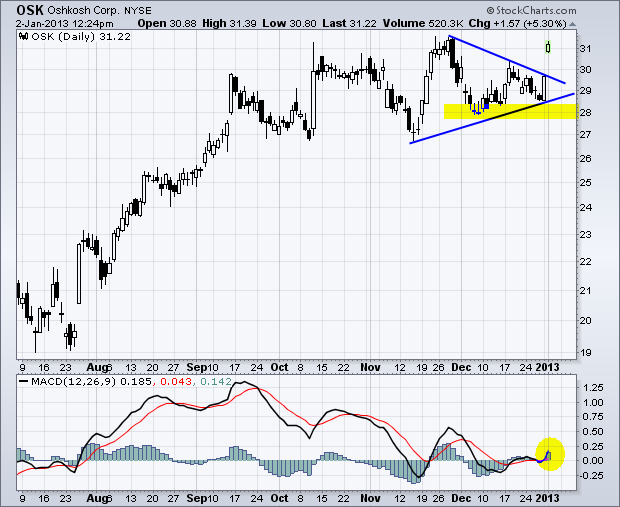
Lots of stocks are coming across the gap up scan today (297 at last count). The chart below shows one list member, Oshkosh, gapping up and breaking above its mid December high. This move reinforces support in the 28 area... Read More
Don't Ignore This Chart! January 01, 2013 at 05:56 PM
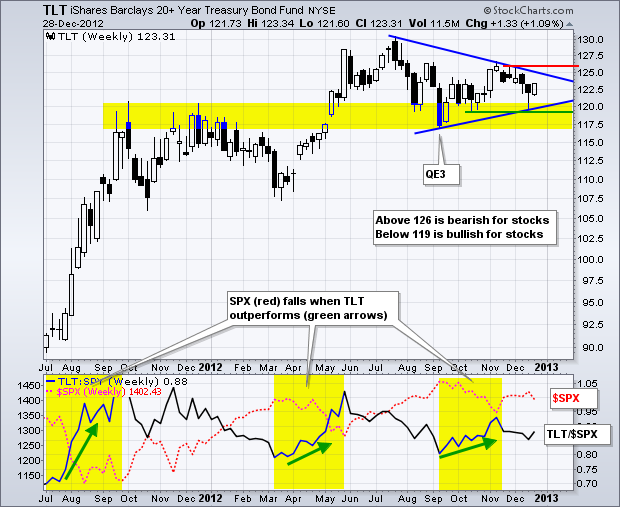
The Fed announced another round of quantitative easing on September 13th and Treasuries have yet to cooperate with this maneuver. Instead of a specific program, the Fed announced an open-ended quantitative easing program that would begin in January 2013... Read More