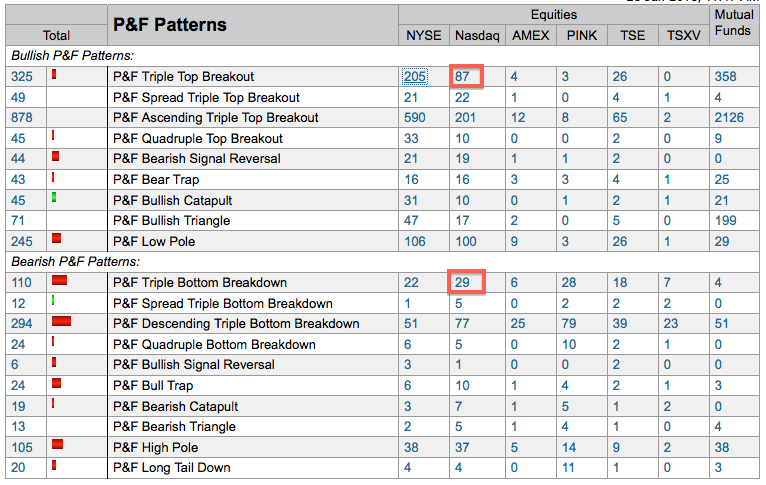
The P&F pattern table on the
predefined scans page is a good place to gauge the long-term trend for the stock market. As with a Bullish Percent Index, chartists simply need to pick a pattern and then compare the number of stocks on bullish P&F signals with the number on bearish P&F signals. There are currently 87 Nasdaq stocks with bullish Triple Top Breakouts and only 22 with bearish Triple Bottom Breakdowns. User can click on these numbers to see a list of the stocks.

About the author:
Arthur Hill, CMT, is the Chief Technical Strategist at TrendInvestorPro.com. Focusing predominantly on US equities and ETFs, his systematic approach of identifying trend, finding signals within the trend, and setting key price levels has made him an esteemed market technician. Arthur has written articles for numerous financial publications including Barrons and Stocks & Commodities Magazine. In addition to his Chartered Market Technician (CMT) designation, he holds an MBA from the Cass Business School at City University in London.
Learn More
