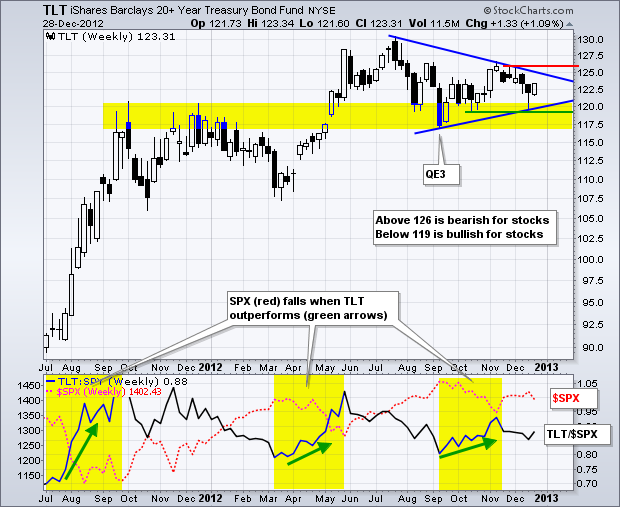
The Fed announced another round of quantitative easing on September 13th and Treasuries have yet to cooperate with this maneuver. Instead of a specific program, the Fed announced an open-ended quantitative easing program that would begin in January 2013. QE is supposed to be bearish for treasuries because the Fed is trying to drive money away from safe-haven Treasuries and into riskier assets, like stocks. So far, the stock market fell and ended the year below its September high. The 20+ Year T-Bond ETF (TLT) rose and ended above its September low. QE3+ does is not working - yet. The response to QE3 is important because Treasuries are negatively correlated with stocks. Stocks rise when Treasuries fall and visa versa. Chartists should, therefore, watch Treasuries for clues on the stock market in 2013. The chart below shows TLT forming a large triangle from July to December and the resolution of this pattern will have serious ramifications for stocks. An upside breakout would be bullish for Treasuries and bearish for stocks. Conversely, a downside break would be bearish for Treasuries and bullish for stocks.

Click this image for a live chart

Click this image for a live chart

About the author:
Arthur Hill, CMT, is the Chief Technical Strategist at TrendInvestorPro.com. Focusing predominantly on US equities and ETFs, his systematic approach of identifying trend, finding signals within the trend, and setting key price levels has made him an esteemed market technician. Arthur has written articles for numerous financial publications including Barrons and Stocks & Commodities Magazine. In addition to his Chartered Market Technician (CMT) designation, he holds an MBA from the Cass Business School at City University in London.
Learn More