Don't Ignore This Chart! May 31, 2013 at 12:12 PM
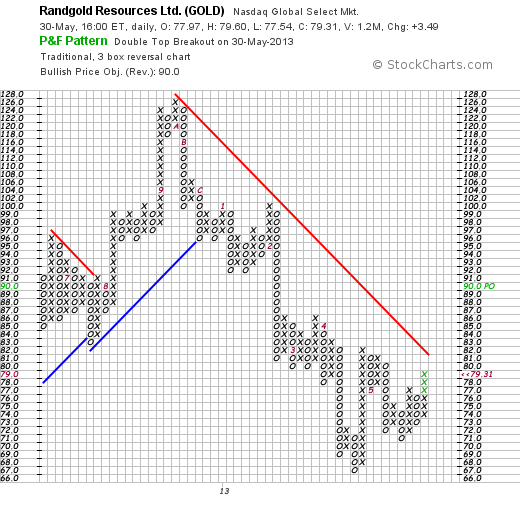
Gold stocks remain down in the dumps and in long-term downtrends, but signs of short-term strength are emerging. Randgold (GOLD) formed a higher low in May and the current X-Column broke above the prior X-Column to forge a P&F breakout... Read More
Don't Ignore This Chart! May 30, 2013 at 10:51 AM
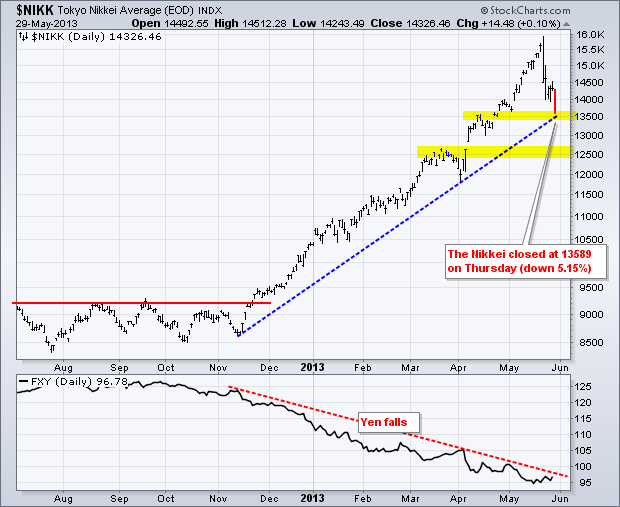
For the second Thursday in a row, the Nikkei 225 ($NIKK) fell over 5% and extended its correction. While the decline from 15900 looks dramatic, it is still just a correction within a bigger uptrend and pales in comparison to the prior surge... Read More
Don't Ignore This Chart! May 28, 2013 at 06:31 PM
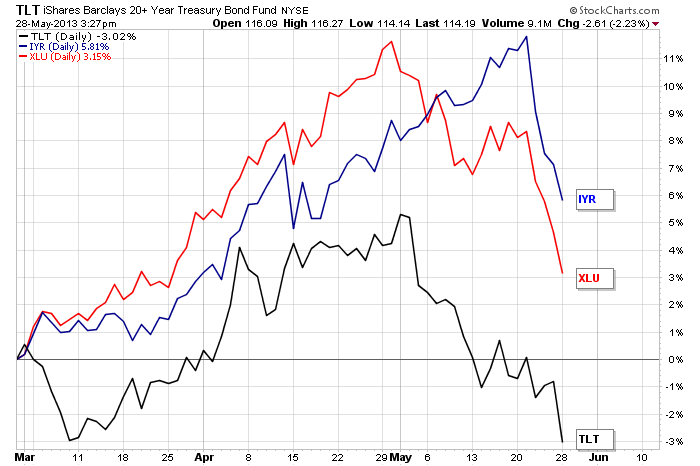
The Utilities SPDR (XLU) and the 20+ Year T-Bond ETF (TLT) both peaked in early May and declined sharply the last four weeks. The Real Estate iShares (IYR) continued higher into mid May, but peaked last week and fell sharply the last four days... Read More
Don't Ignore This Chart! May 24, 2013 at 09:32 AM
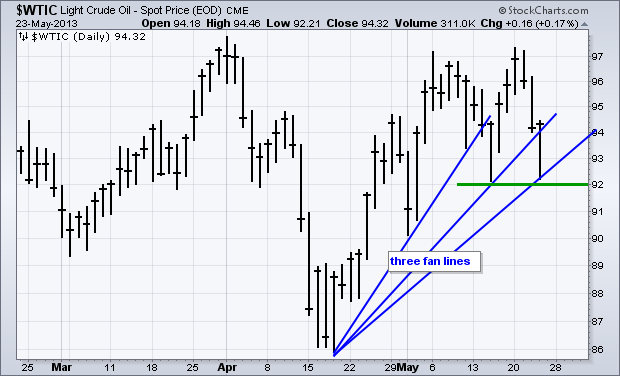
Spot Light Crude ($WTIC) has been quite volatile the last few weeks with two declines from the 97 area and two bounces off the 92 area. It is possible to draw three trend lines extending up from the mid April low... Read More
Don't Ignore This Chart! May 23, 2013 at 11:50 AM
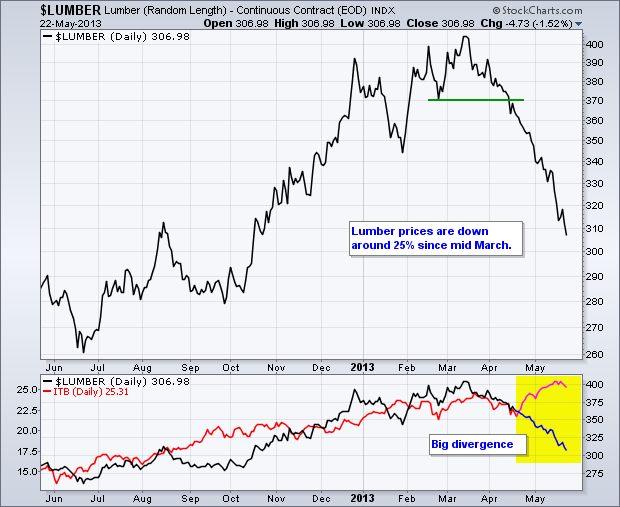
An interesting divergence is brewing between lumber and housing stocks. Lumber Futures ($LUMBER) fell around 25% the last two months, but the Home Construction iShares (ITB) hit a 52-week high recently... Read More
Don't Ignore This Chart! May 21, 2013 at 03:14 PM
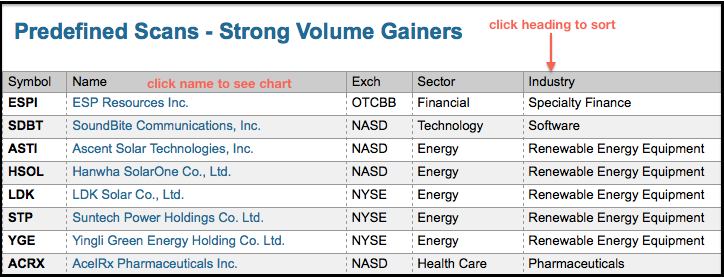
Solar stocks are on the move today and volume is increasing in several names. The image below comes from the "strong volume gainers" scan on the pre-defined scans page. Click any of the headings to sort this table. There are five solar-related stocks making the cut... Read More
Don't Ignore This Chart! May 20, 2013 at 02:29 PM
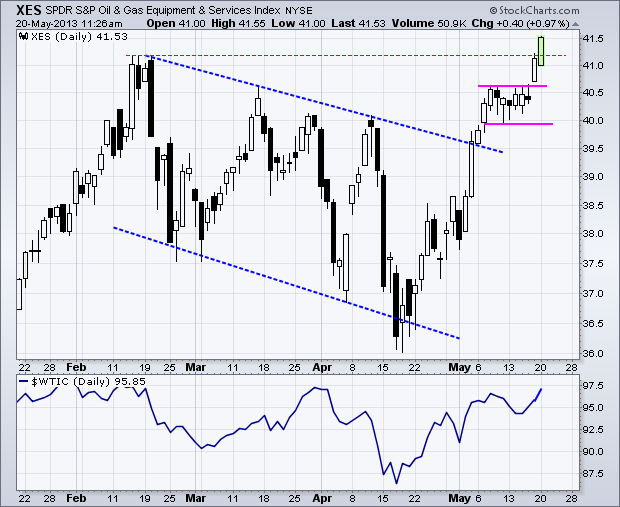
Energy related stocks are catching a bid as Spot Light Crude ($WTIC) challenges the $97. The chart below shows the Oil & Gas Equipment/Services SPDR (XES) breaking flag resistance and hitting a 52-week high on Monday. The flag zone now turns into support... Read More
Don't Ignore This Chart! May 16, 2013 at 02:58 PM
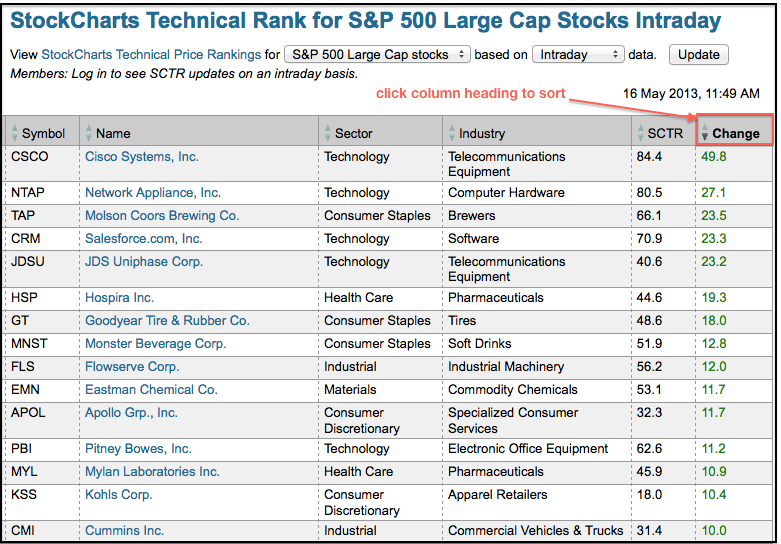
Chartists can view the StockCharts Technical Rank (SCTR) for stocks in the S&P 500, S&P SmallCap 600, S&P MidCap 400 and Toronto Stock Exchange. These ranks can be sorted by change to find the biggest movers. Simply click the column heading the sort... Read More
Don't Ignore This Chart! May 15, 2013 at 03:18 PM
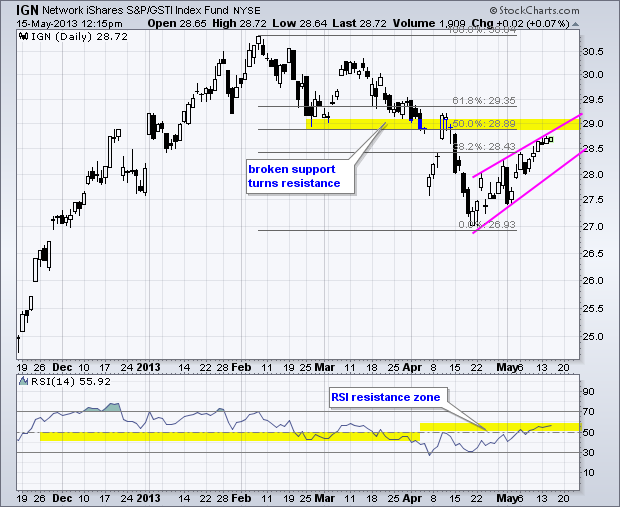
The Networking iShares (IGN) moved lower from early February to mid April and then bounced the last five weeks. This bounce is forming a rising wedge and nearing broken support, which turns resistance. RSI is also in its resistance zone (50-60)... Read More
Don't Ignore This Chart! May 14, 2013 at 02:40 PM
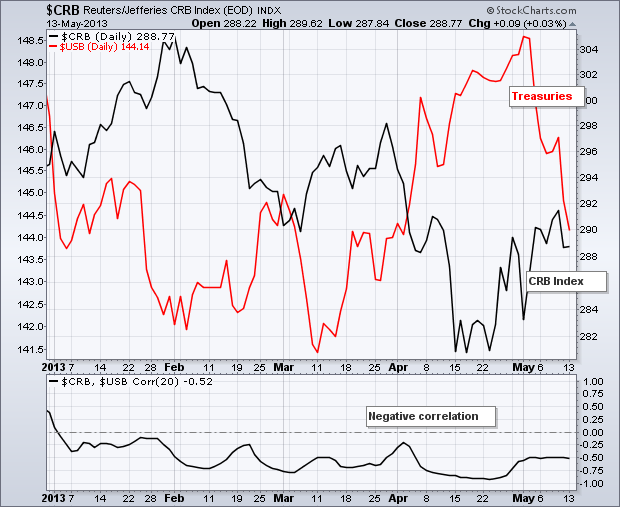
The overall trend for the CRB Index ($CRB) is down this year, but the index bounced back above 288 this month. It looks like a strong jobs report and rebound in commodities was more than Treasuries could take as the 30-Year US Treasury ($USB) fell over 4% this month... Read More
Don't Ignore This Chart! May 13, 2013 at 04:54 PM
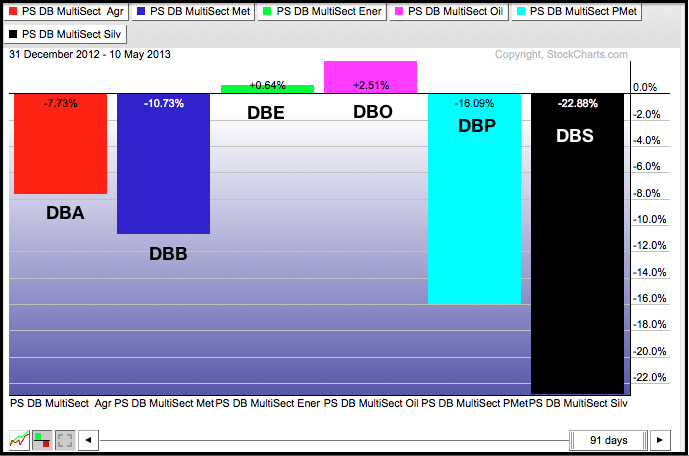
The chart below shows six commodity group ETFs from PowerShares. The Silver Trust (DBS) and Precious Metals Trust (DBP) are the weakest year-to-date, while the Energy Trust (PBE) and Oil Trust (DBO) the only ones with gains, albeit small gains... Read More
Don't Ignore This Chart! May 10, 2013 at 09:36 AM
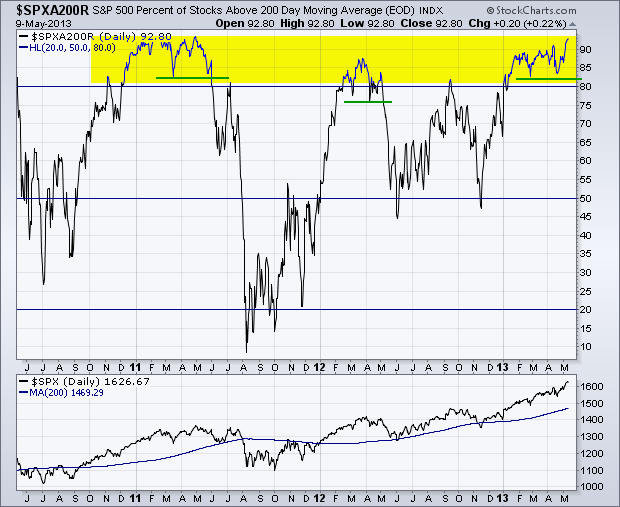
The S&P 500 %Above 200-day SMA ($SPXA200R) is a breadth indicator that measures the degree of participation. The S&P 500 is trading near a 52-week high and over 90% of its components are above their 200-day moving average... Read More
Don't Ignore This Chart! May 09, 2013 at 02:30 PM
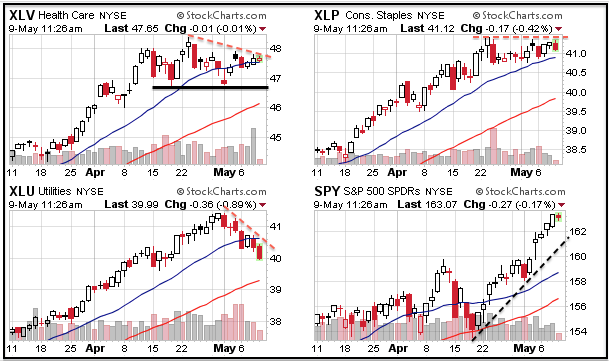
The S&P 500 ETF (SPY) surged to new highs in May, but the defensive sectors did not go along for the ride. The CandeGlance charts below show the Healthcare SPDR (XLV), Consumer Staples SPDR (XLP) and Utilities SPDR (XLU) peaking in late April... Read More
Don't Ignore This Chart! May 08, 2013 at 02:11 PM
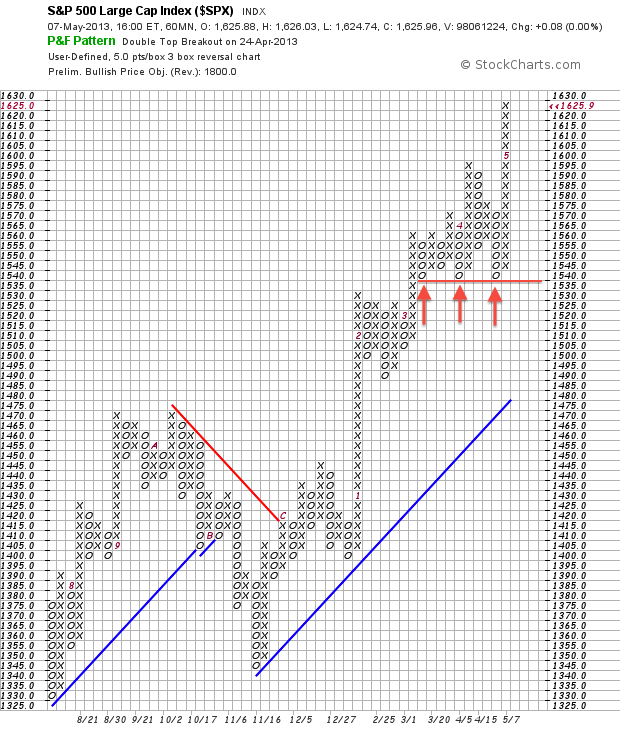
Point & Figure charts filter out the noise and ignore time to give chartists a clean look at price action. On the 60-minute P&F chart below, the S&P 500 bounced off the 1540 level three times since mid March... Read More
Don't Ignore This Chart! May 07, 2013 at 06:49 PM
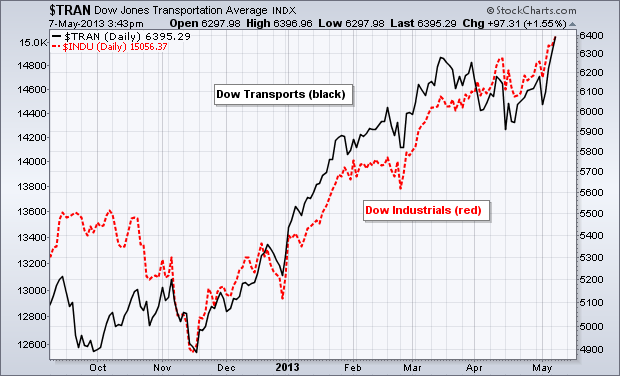
According to Dow Theory, a bull signal is in force when both the Dow Industrials and Dow Transports move to new highs. Well, this happened today as both the Dow Industrials and Dow Transports forged fresh 52-week highs... Read More
Don't Ignore This Chart! May 06, 2013 at 02:54 PM
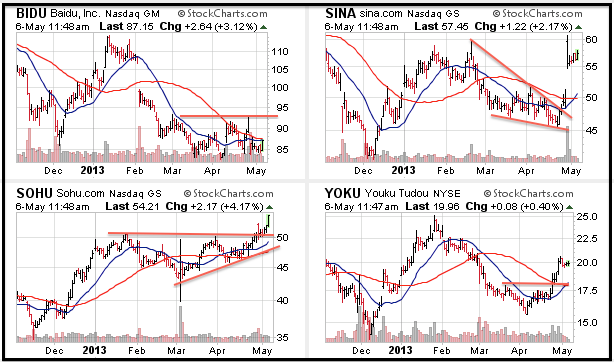
Three of the four Chinese internet stocks shown below broke resistance with surges over the last 1-2 weeks. SOHU hit a new high with a break above 50. SINA broke wedge resistance and then gapped up. YOKU broke resistance with a high volume surge to 20... Read More
Don't Ignore This Chart! May 03, 2013 at 02:23 PM
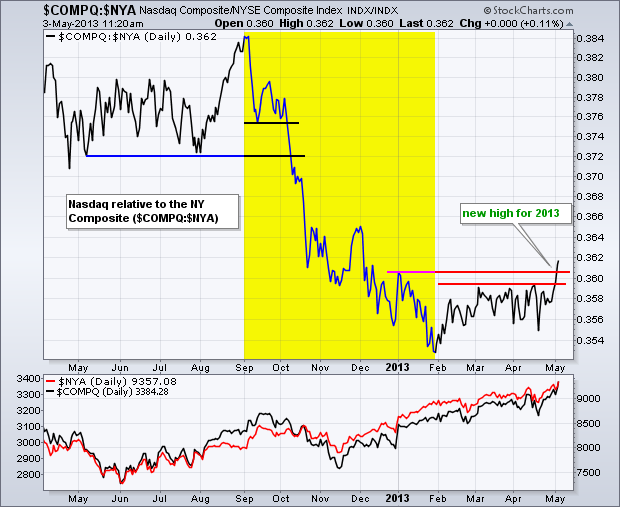
The Nasdaq underperformed the NY Composite ($NYA) from September to January as the $COMPQ:$NYA ratio plunged for five months (yellow area)... Read More
Don't Ignore This Chart! May 02, 2013 at 11:00 AM
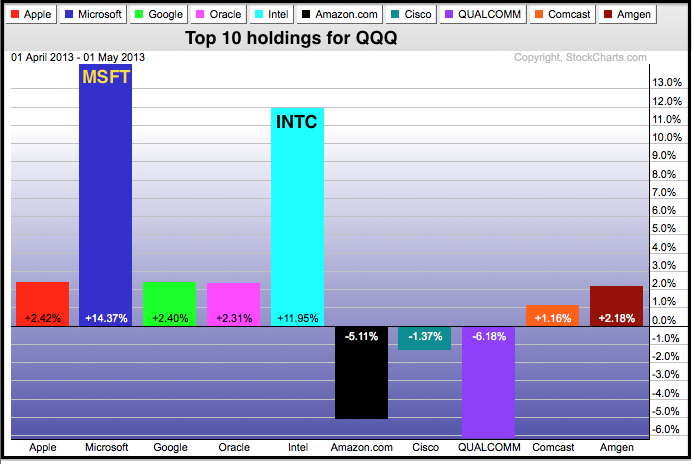
The Nasdaq 100 ETF (QQQ) sprang to life in April with the help of two unusual suspects. We would normally expect Google, Amazon or Apple to lead a big tech rally, but April saw the return of old tech as Microsoft and Intel stole the show... Read More
Don't Ignore This Chart! May 01, 2013 at 07:51 PM
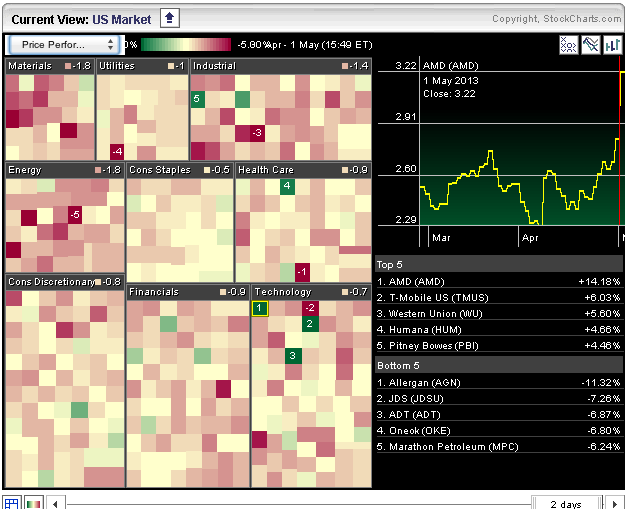
The stock market was down sharply on Wednesday, but there were a few big gainers. Chartists can spot the rebels by looking for green on the Sector Market Carpet. Today, we have AMD surging over 14% and T-Mobile (TMUS) advancing over 6%... Read More