Don't Ignore This Chart! July 30, 2013 at 02:02 PM
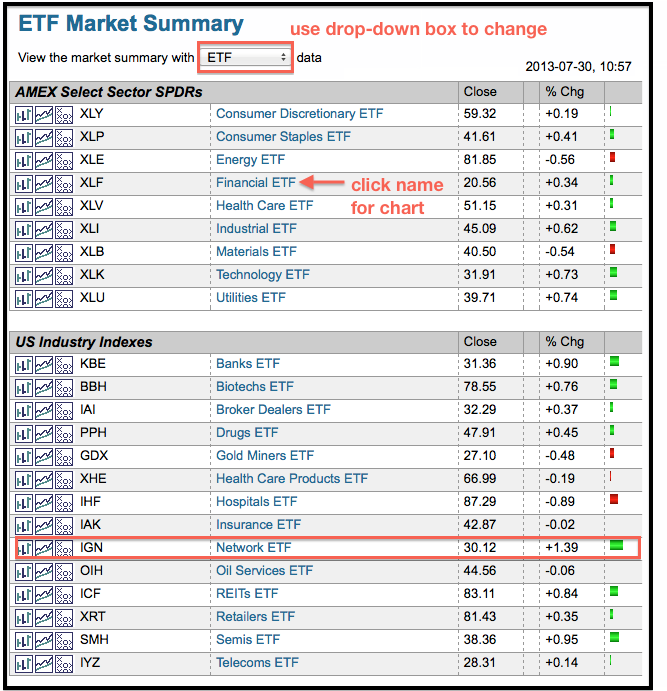
The Market Summary (ETF mode) provides a quick overview of performance for groups of ETFs. These include broad market, sector, industry group, international, bond, commodity and currency ETFs... Read More
Don't Ignore This Chart! July 29, 2013 at 04:02 PM
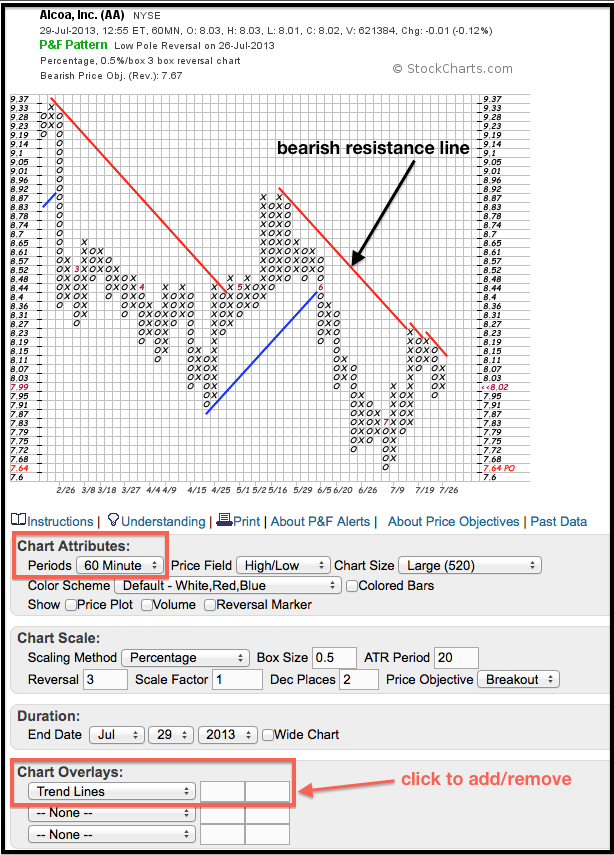
StockCharts gives users the power to chart intraday P&F charts with trend lines. In this example, the 60-minute P&F Chart shows Alcoa (AA) breaking the Bullish Support Line in June (red 6) and moving to new lows... Read More
Don't Ignore This Chart! July 26, 2013 at 02:49 PM
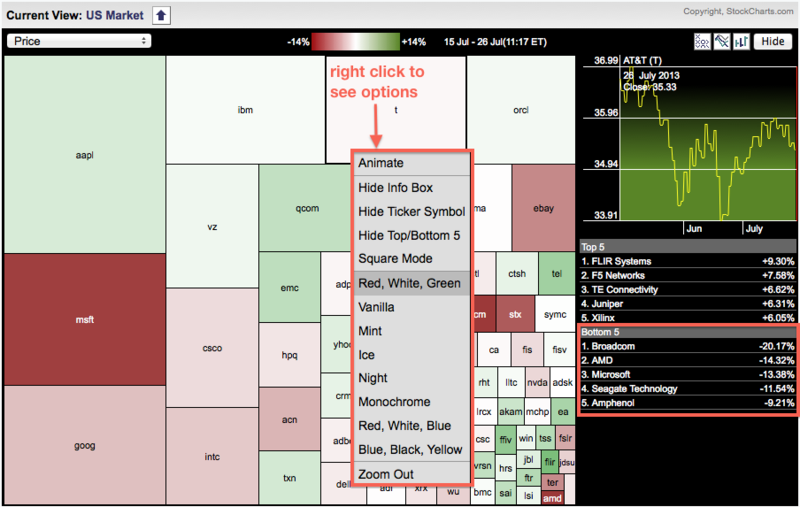
It was a rough two weeks for tech stocks as Broadcom (BRCM), AMD (AMD), Microsoft (MSFT) and Seagate (STX) led the way lower with double digit losses. Micrsoft, Google and Ebay weighed on the sector because they have relatively large market caps... Read More
Don't Ignore This Chart! July 25, 2013 at 02:49 PM
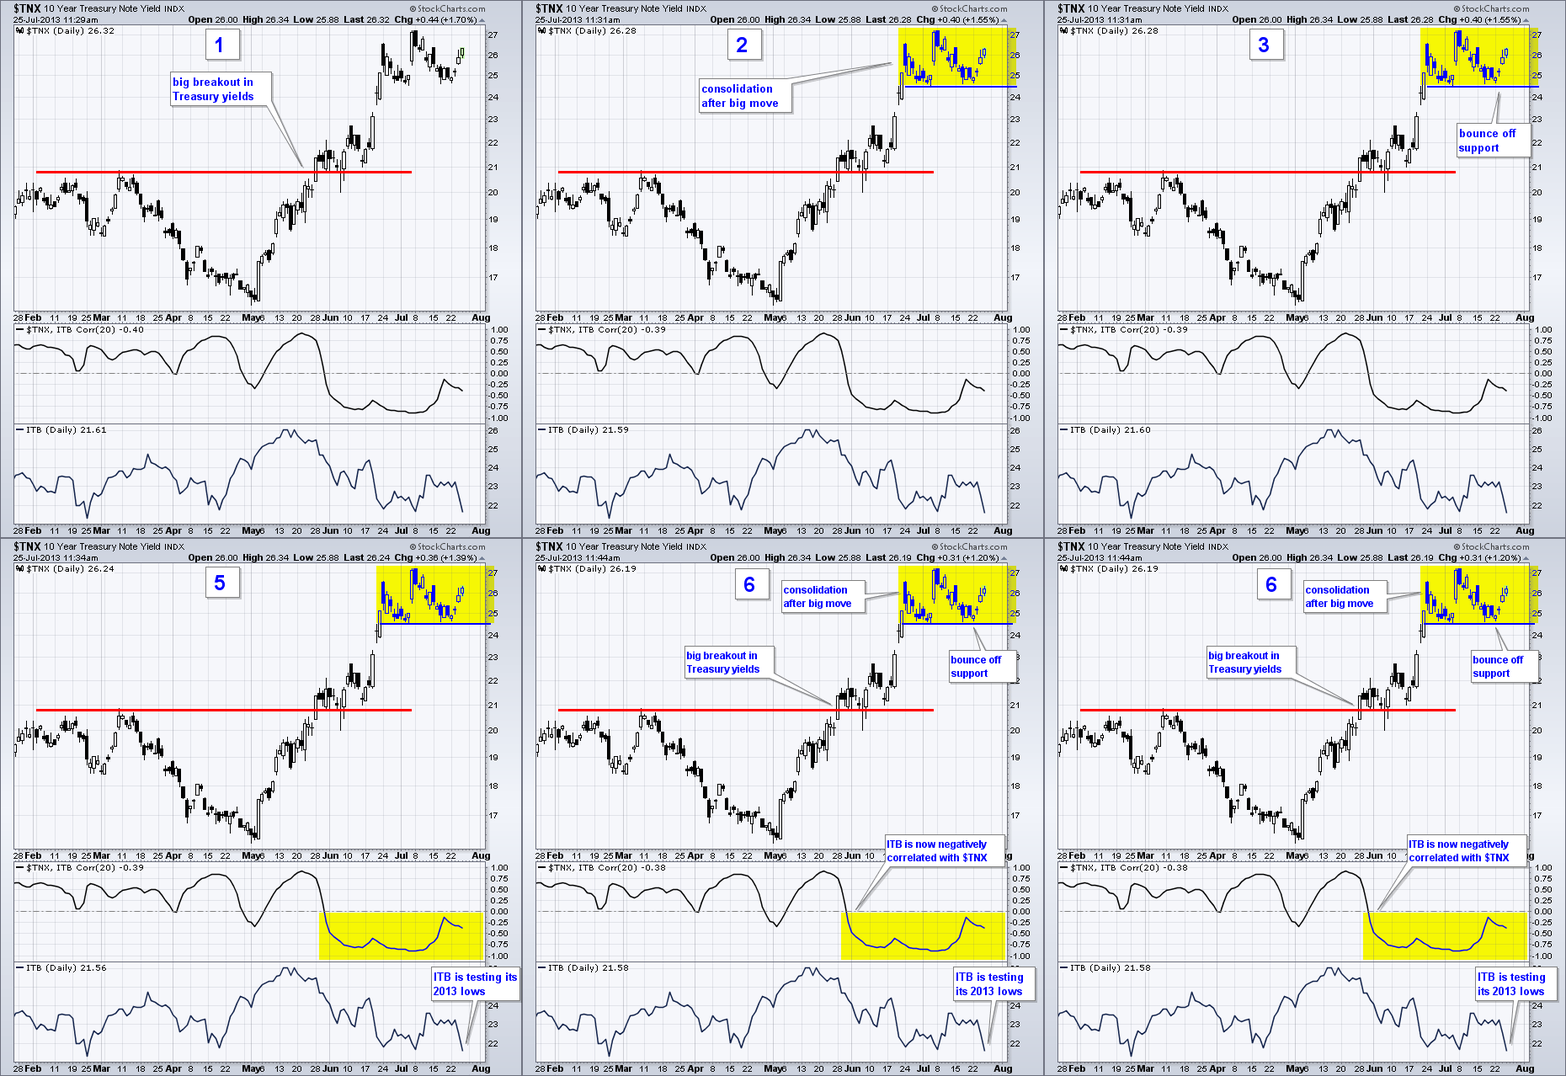
The 10-year Treasury Yield ($TNX) surged from 1.6% to 2.6% and then consolidated for a few weeks. Yields could be starting another leg up as $TNX bounces off support this week. This is having a negative impact on homebuilders... Read More
Don't Ignore This Chart! July 24, 2013 at 06:06 PM
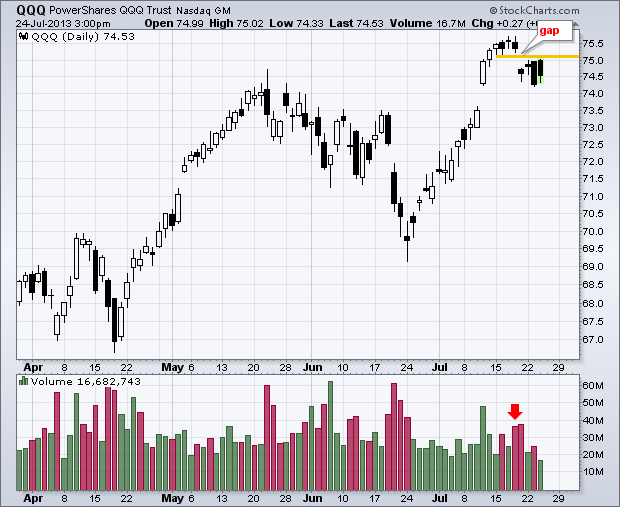
The Nasdaq 100 ETF (QQQ) got a lift from Apple on Wednesday, but could not hold its early gains as sharp losses in Broadcom (BRCM) and Panera Bread (PNRA) weighed. The chart below shows QQQ gapping down last week and holding this gap the last four days... Read More
Don't Ignore This Chart! July 23, 2013 at 06:07 PM
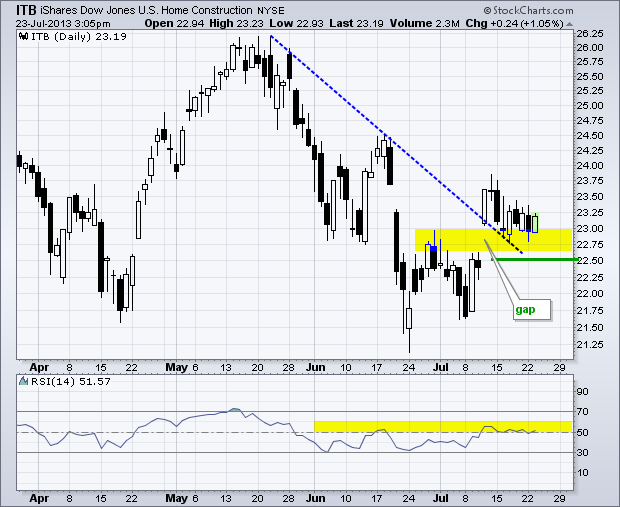
The Home Construction iShares (ITB) broke out with a gap in mid July and this breakout is still holding. The ETF pulled back into the gap zone, but never completely filled the gap to negate the breakout. The indicator window shows RSI moving into the 50-60 zone and stalling... Read More
Don't Ignore This Chart! July 22, 2013 at 05:30 PM
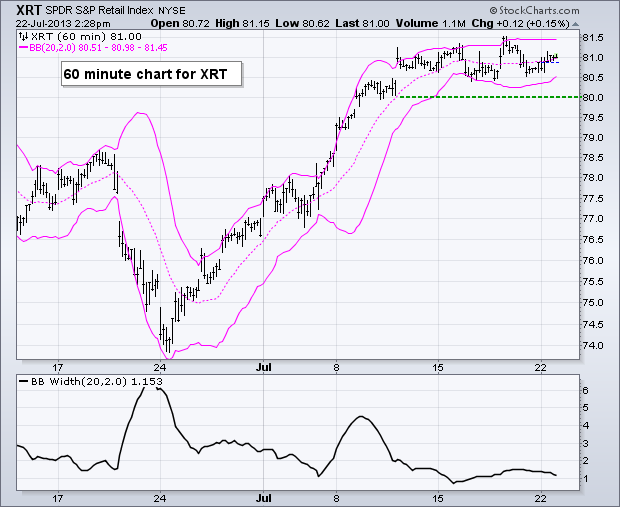
The Retail SPDR (XRT) surged from late June to mid July and then embarked on a rather narrow consolidation. Notice that the ETF traded between 80.3 and 81.6 since July 11th. The overall trend is up, and this favors an upside breakout or continuation higher... Read More
Don't Ignore This Chart! July 19, 2013 at 02:20 PM
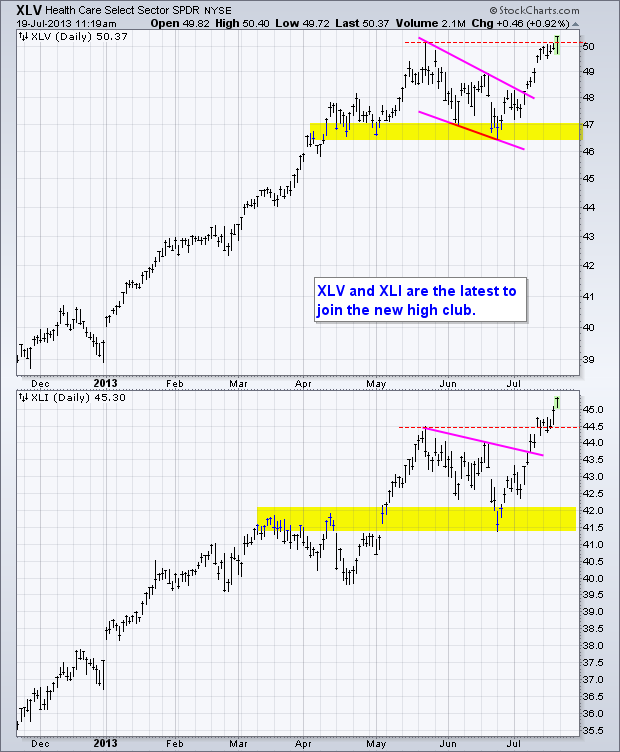
The Consumer Discretionary SPDR (XLY) and the Finance SPDR (XLF) were the first two sectors to reach 52-week highs this month. With big moves over the last few days, the Healthcare SPDR (XLV) and the Industrials SPDR (XLI) join the club... Read More
Don't Ignore This Chart! July 18, 2013 at 01:58 PM
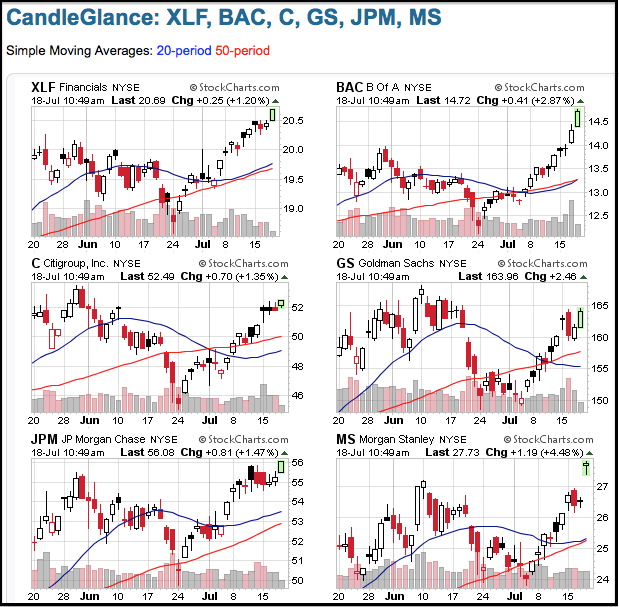
The Finance SPDR (XLF) surged to a fresh 52-week high with leadership from Morgan Stanley (MS), Bank of America (BAC) and JP Morgan (JPM). The CandleGlance chart below shows these three hitting 52-week highs... Read More
Don't Ignore This Chart! July 17, 2013 at 04:11 PM
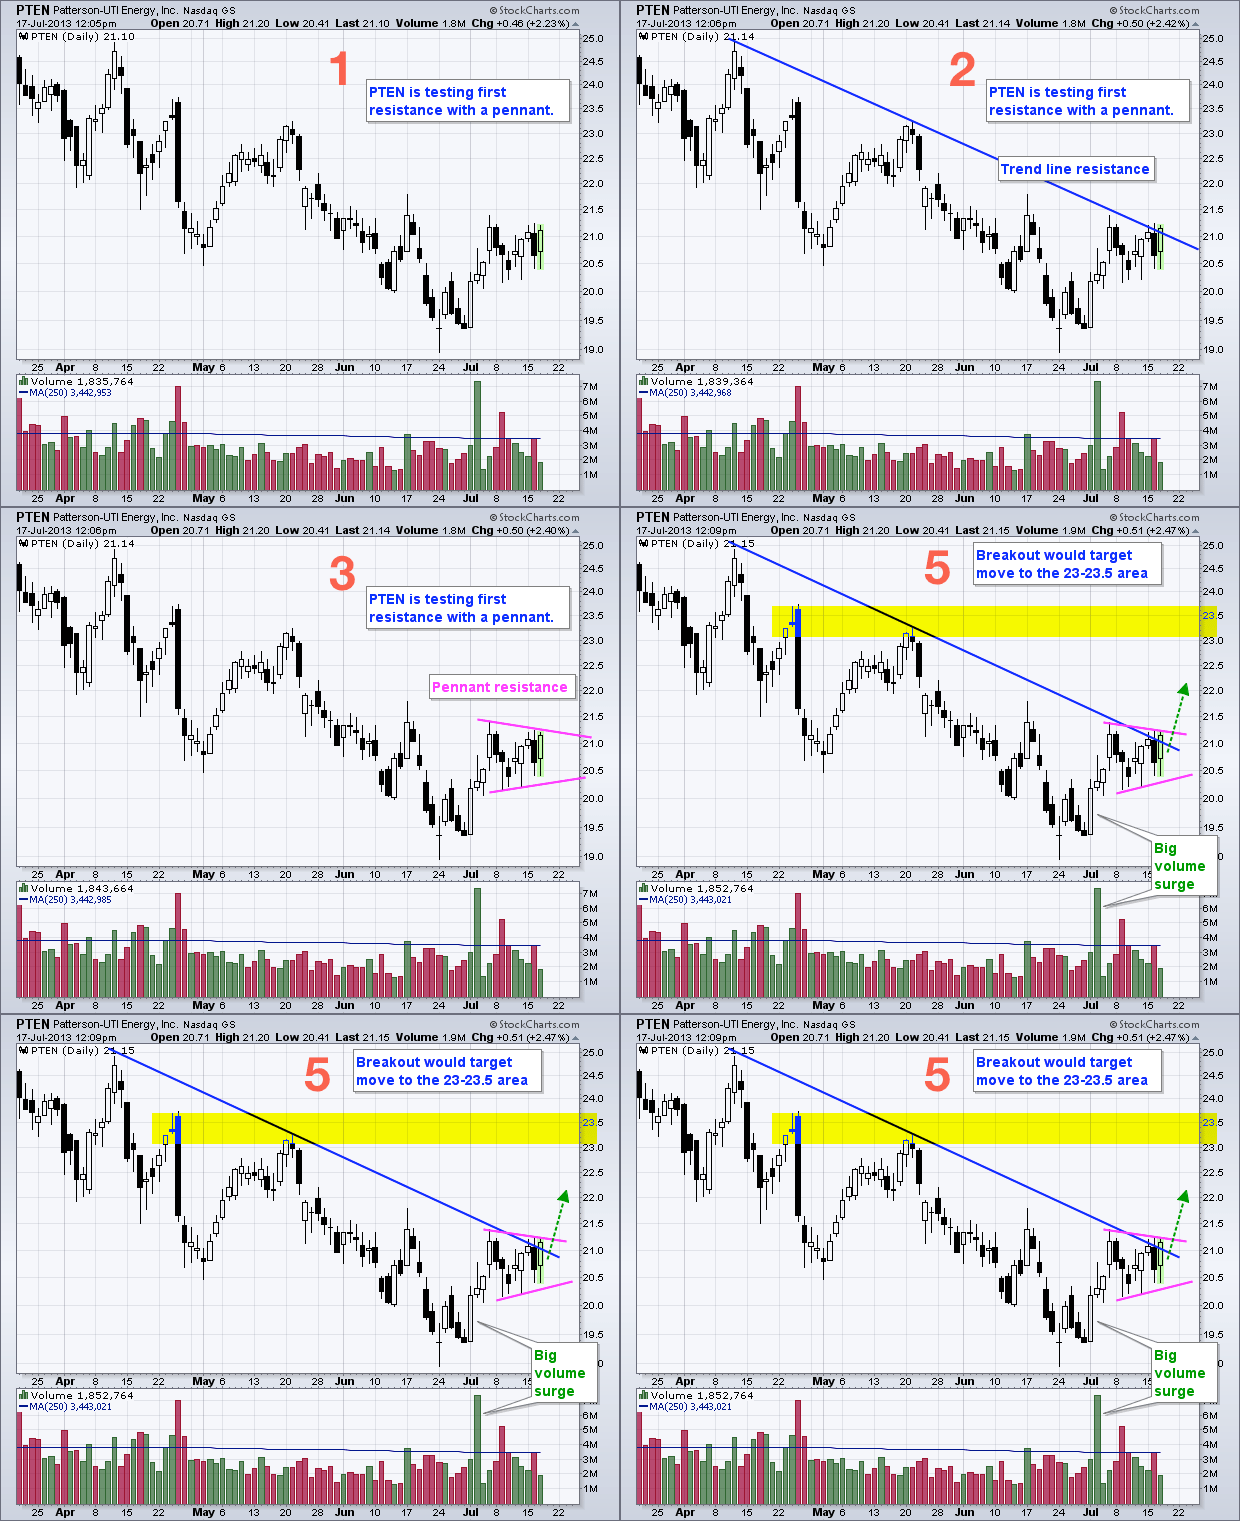
Patternson Energy (PTEN) has been lagging the market and the energy sector the last few months, but shows signs of life with a high volume surge and pennant. A pennant breakout would signal a continuation higher and target a move to the next resistance zone... Read More
Don't Ignore This Chart! July 16, 2013 at 12:07 PM
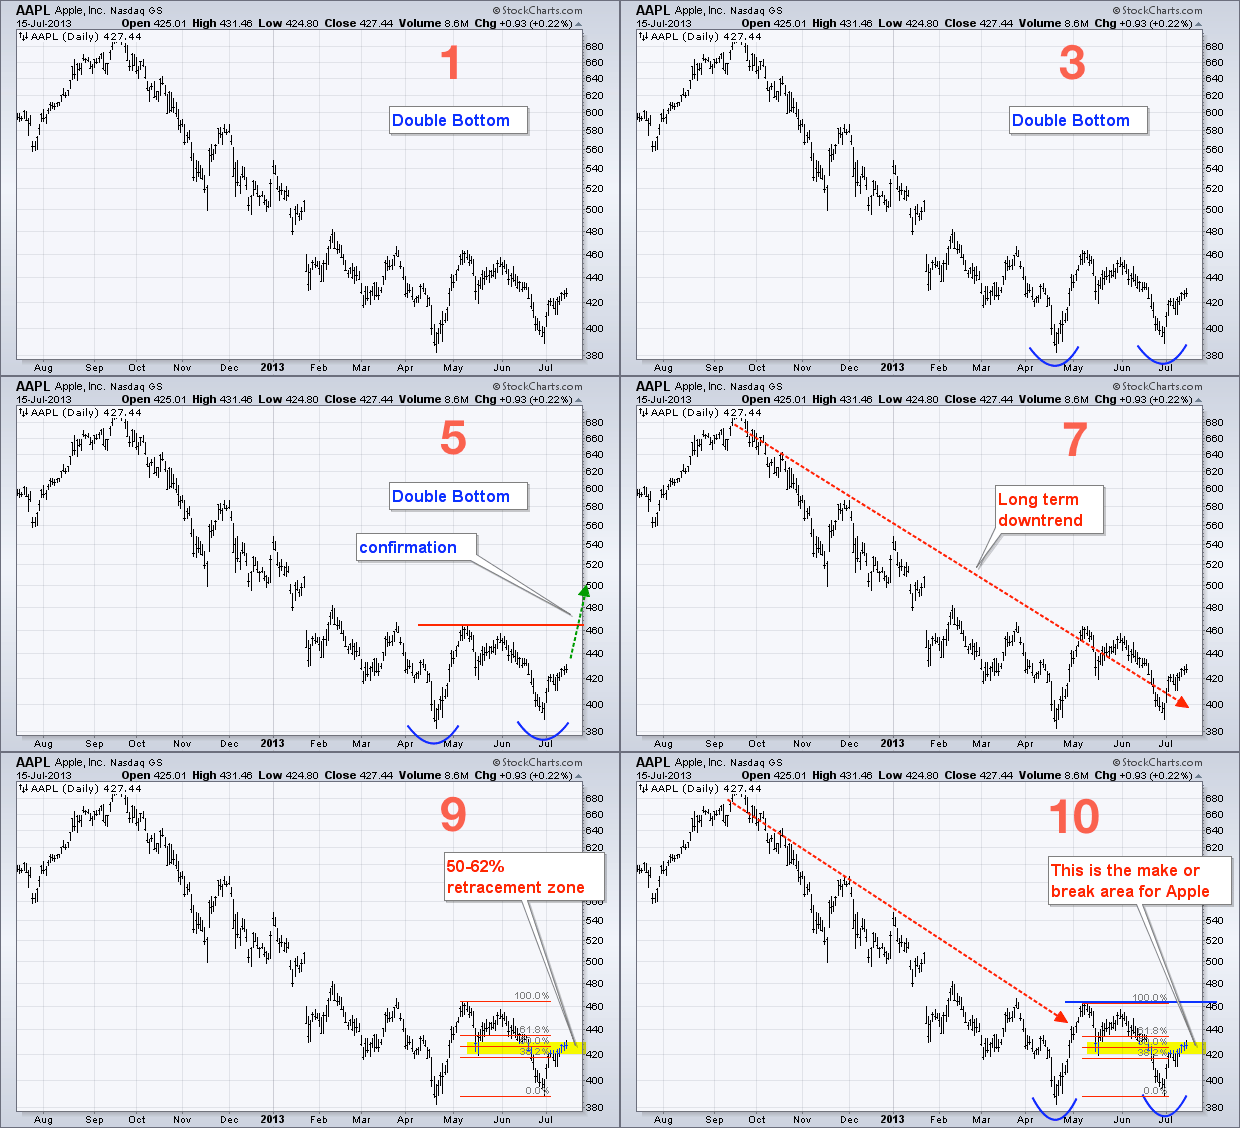
The animated chart below shows Apple at a key resistance zone right now. A double bottom could be forming, but the stock is in a long-term downtrend and stalling in the middle of the three month range. A move above 435 would open the door for a double bottom resistance test... Read More
Don't Ignore This Chart! July 15, 2013 at 02:10 PM
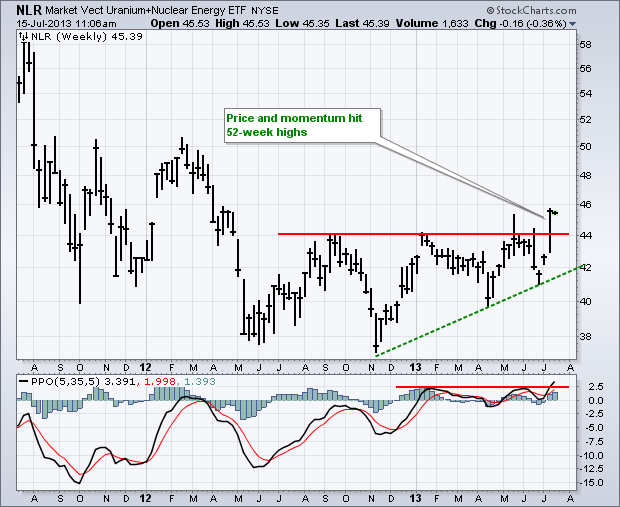
The Uranium-Nuclear ETF (NLR) caught a bid last week and broke resistance to forge a 52-week high. Notice that a series of rising troughs (green line) preceded this breakout. The indicator window shows MACD confirming strength with a 52-week high of its own... Read More
Don't Ignore This Chart! July 08, 2013 at 08:45 AM
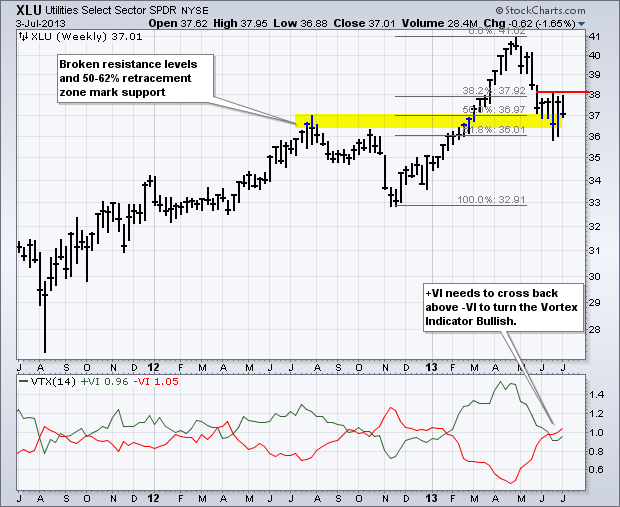
The Utilities SPDR (XLU) is consolidating at a potential support level and traders should watch the consolidation high for a breakout. First, notice how broken resistance and the Fibonacci retracements mark support in the 36-36 area... Read More
Don't Ignore This Chart! July 05, 2013 at 08:15 AM
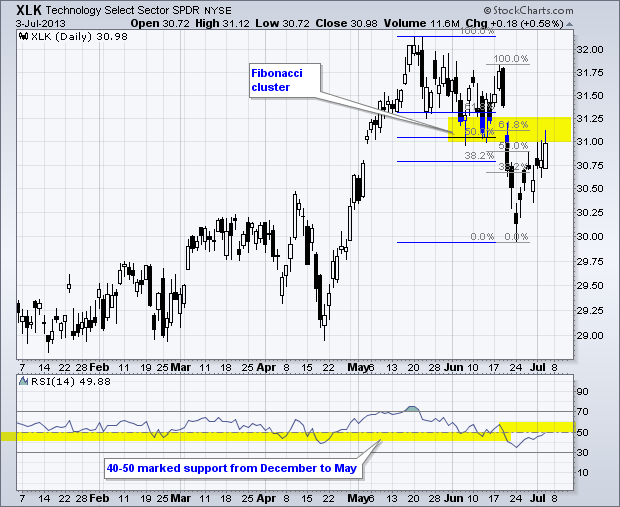
After a plunge from mid May to mid June, the Technology SPDR (XLK) bounced back to the 31 area to reach its first resistance area. First, broken support turns into resistance here. Second, the Fibonacci retracements tools show a cluster in the 31-31.33 area... Read More