Don't Ignore This Chart! September 27, 2013 at 03:05 PM
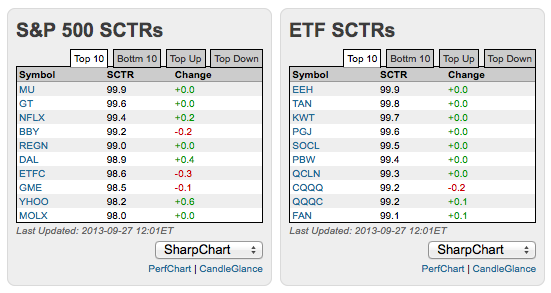
Looking for the relative movers and shakers in the market? Look no further than the StockCharts Technical Rank (SCTR) on the StockCharts home page. These tables can be found mid way down the home page... Read More
Don't Ignore This Chart! September 26, 2013 at 05:41 PM
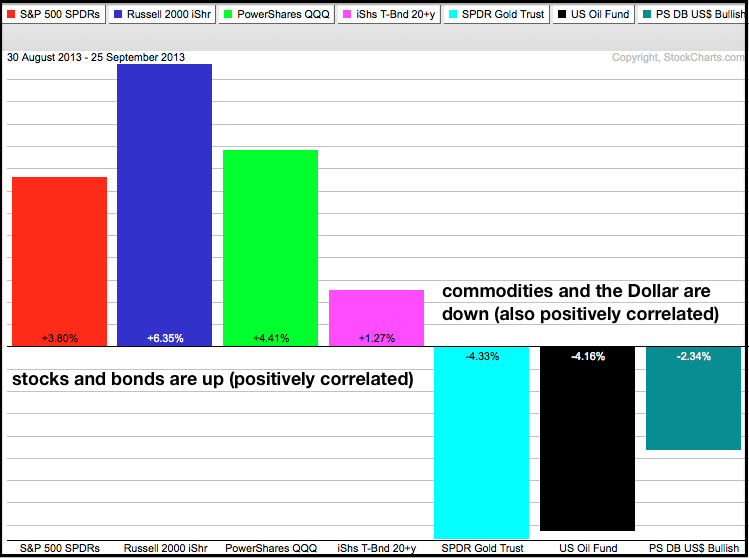
The PerfChart below shows six inter-market related ETFs. Notice that stocks are up with the Russell 2000 ETF (IWM) leading the way (blue). Bonds are also up for the month and this is strange because stocks and bonds are usually negatively correlated... Read More
Don't Ignore This Chart! September 26, 2013 at 05:40 PM
The PerfChart below shows six inter-market related ETFs. Notice that stocks are up with the Russell 2000 ETF (IWM) leading the way (blue). Bonds are also up for the month and this is strange because stocks and bonds are usually negatively correlated... Read More
Don't Ignore This Chart! September 25, 2013 at 06:35 PM
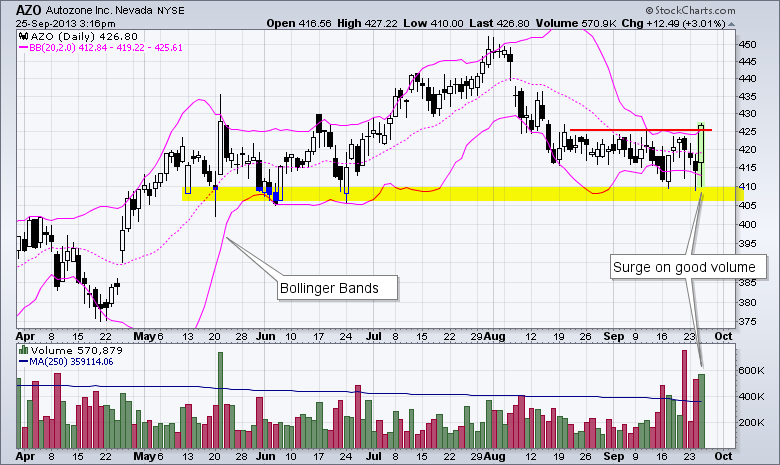
Autozone (AZO) surged off support and broke above the upper Bollinger Band with big volume on Wednesday. I found this stock because it made the predefined scans list (intraday). This move affirms support and opens the door for a continuation of the bigger uptrend... Read More
Don't Ignore This Chart! September 24, 2013 at 02:52 PM
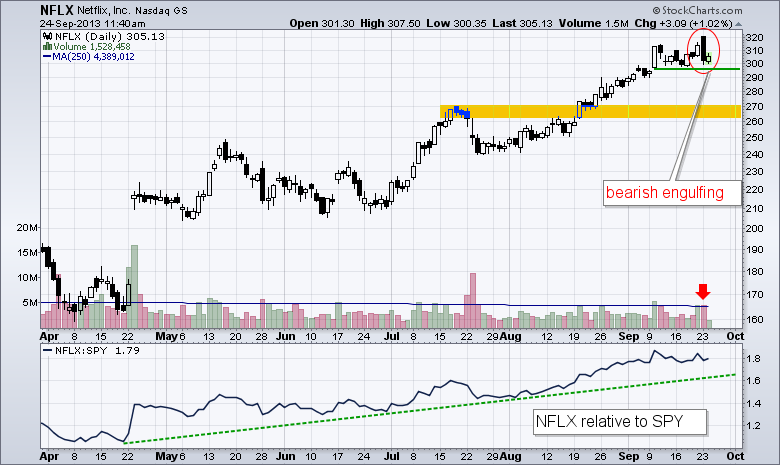
Netflix opened at a new on Monday, but selling pressure quickly took hold and drove prices below 203 by the close. This intraday reversal forged a bearish engulfing pattern just above first support... Read More
Don't Ignore This Chart! September 23, 2013 at 04:21 PM
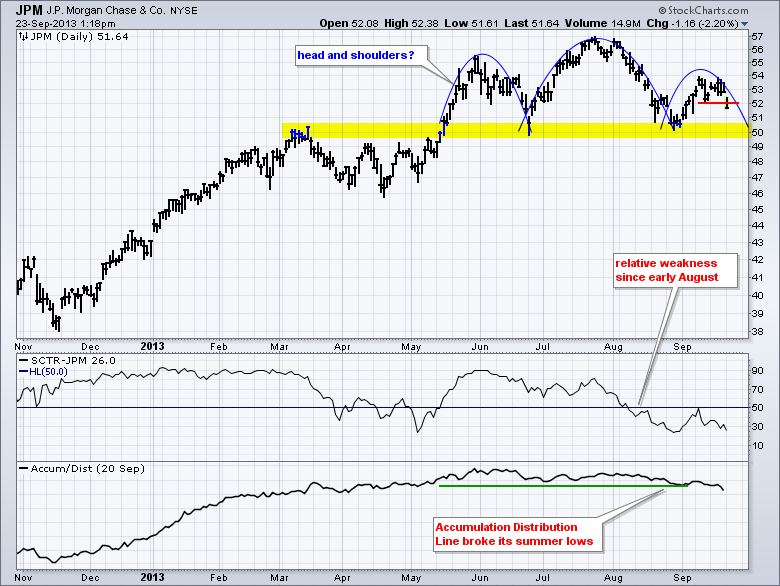
JP Morgan (JPM) broke short term support with a sharp decline on Monday. With a lower high taking shape, the stock is forming a larger head-and-shoulders reversal over the last few months... Read More
Don't Ignore This Chart! September 20, 2013 at 12:44 PM
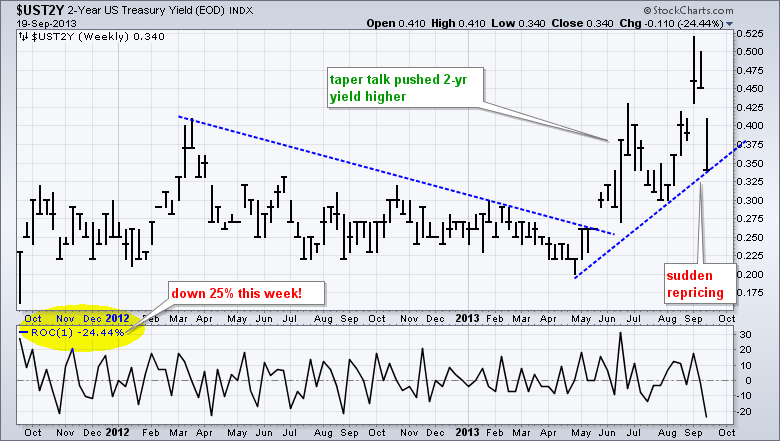
The Treasury market was thrown for a loop this week as the Fed unexpectedly decided not the taper. The chart below shows the 2-Year Treasury Yield ($UST2Y) bearing the brunt of this "adjustment". Notice how the yield advanced as tapering talk took hold from April to August... Read More
Don't Ignore This Chart! September 19, 2013 at 06:06 PM
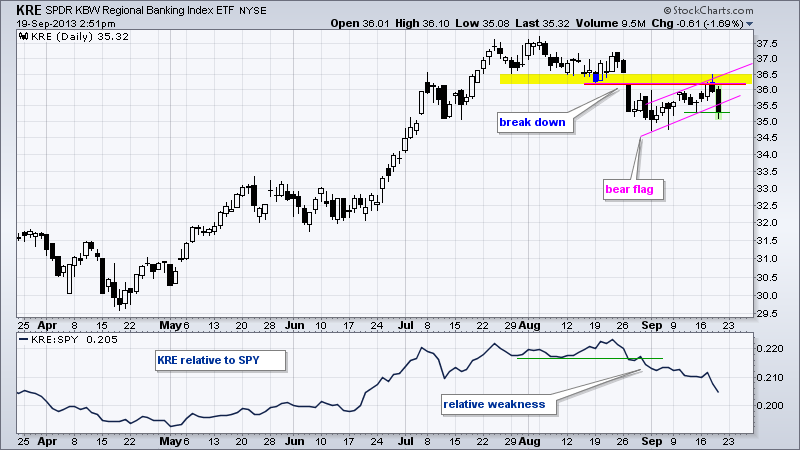
The Regional Bank SPDR (KRE) perked up with a bounce above 36 on Tuesday, but gave it back with a sharp decline on Wednesday-Thursday. Broken support and the late August gap ultimately held as resistance. The flag break signals a continuation lower... Read More
Don't Ignore This Chart! September 18, 2013 at 08:18 PM
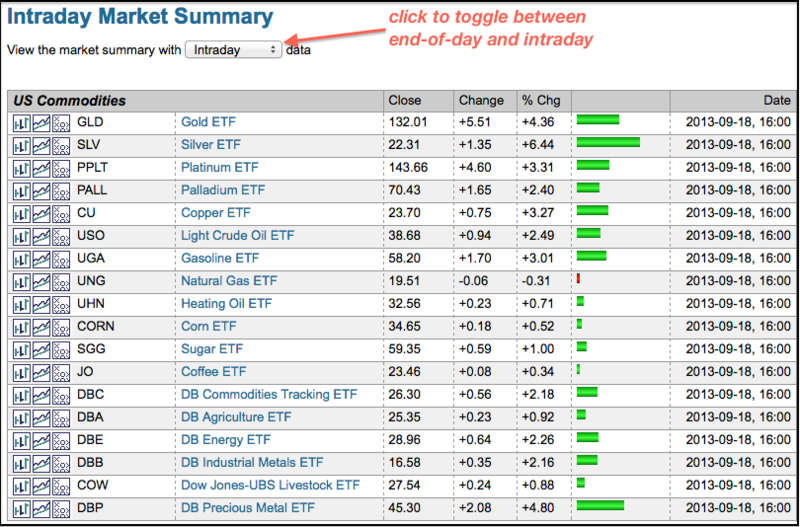
The Dollar fell sharply on Wednesday and this provided a big boost to precious metals, copper and oil. The screen shot below comes from the Intraday Market Summary Page. The Silver Trust (SLV) led precious metals with a 6.44% surge... Read More
Don't Ignore This Chart! September 17, 2013 at 06:12 PM
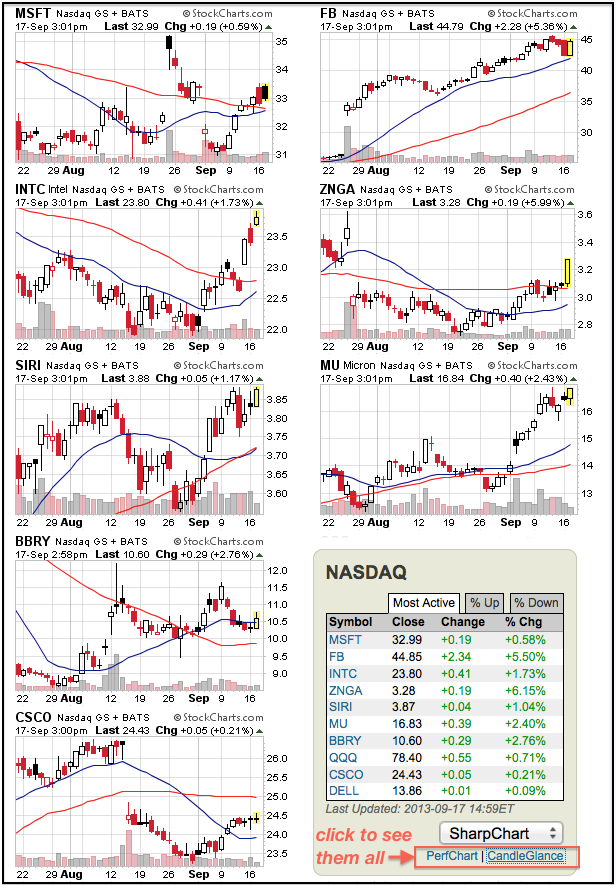
The Nasdaq is moving higher with eight of the ten most active stocks advancing. DELL and QQQ are also up, but I am leaving them out of the top ten. Facebook (FB) is leading the charge with a 5+ percent gain, and Intel is up over 1.5% on the day... Read More
Don't Ignore This Chart! September 16, 2013 at 05:41 PM
The screenshot below comes from the Predefined Technical Alerts Summary. There is a lot of strength in the stock market with the Russell 2000 and Nasdaq hitting multi-year highs... Read More
Don't Ignore This Chart! September 13, 2013 at 04:33 PM
Intel is on the move with its second gap of the month. Intel started September strong with a small gap and surge above 22.50. After a small three day pullback this week, the stock continued higher again with a gap above 23... Read More
Don't Ignore This Chart! September 12, 2013 at 12:54 PM
It has been a good month for eight of the nine sectors. Eight of the nine are up month-to-date with the Consumer Discretionary SPDR (XLY), Industrials SPDR (XLI) and Finance SPDR (XLF) among the leaders... Read More
Don't Ignore This Chart! September 11, 2013 at 11:41 AM
The video and chart below shows the AD Line for the S&P 1500 breaking above its mid August highs with a surge the last few days. This move appears to have ended the short-term downtrend that began in early August... Read More
Don't Ignore This Chart! September 10, 2013 at 03:28 PM
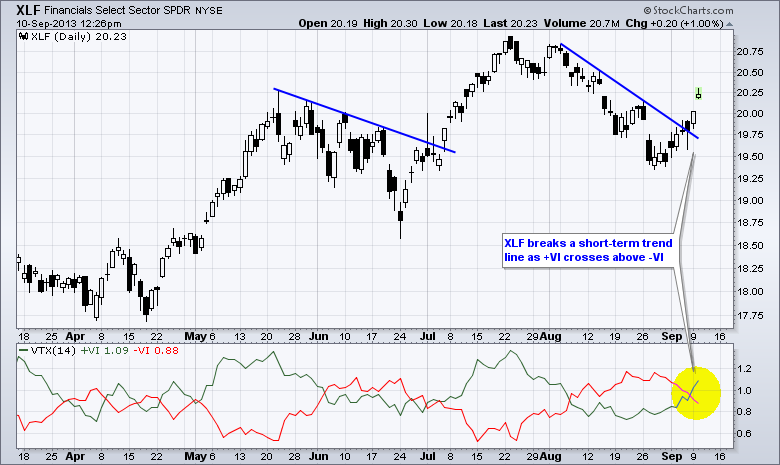
The Finance SPDR (XLF) is starting to perform with a nice surge over the last two weeks. Notice how the ETF broke the August trend line and filled the late August gap to signal an end to the current correction. The Vortex Indicators confirmed as +VI moved above –VI... Read More
Don't Ignore This Chart! September 09, 2013 at 06:03 PM
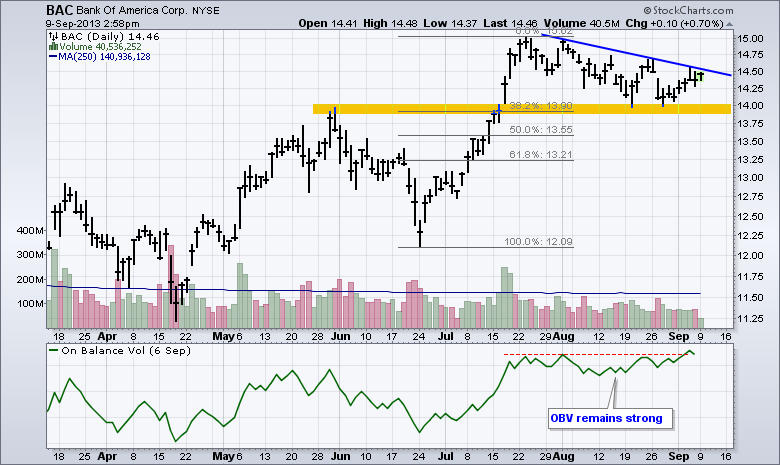
Bank of America (BAC) hit a 52-week high in late July and then corrected with a falling flag or channel the last five weeks. Despite this correction, the indicator window shows On Balance Volume (OBV) remaining strong and hitting a new high last week... Read More
Don't Ignore This Chart! September 06, 2013 at 05:34 PM
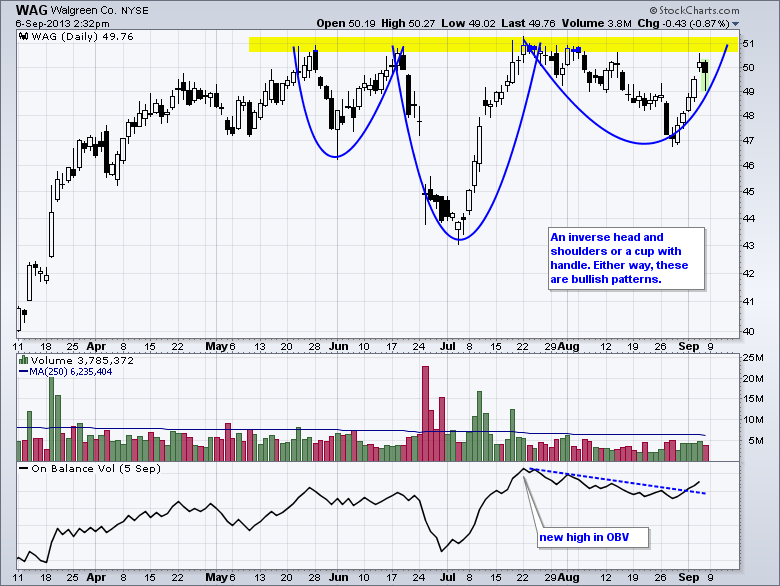
After a big surge from November to May, Walgreen (WAG) consolidated with an inverse head-and-shoulders pattern. This version of the head-and-shoulders is a bullish continuation pattern. Also notice that the pattern from mid June to September looks like a cup-with-handle... Read More
Don't Ignore This Chart! September 05, 2013 at 07:07 PM
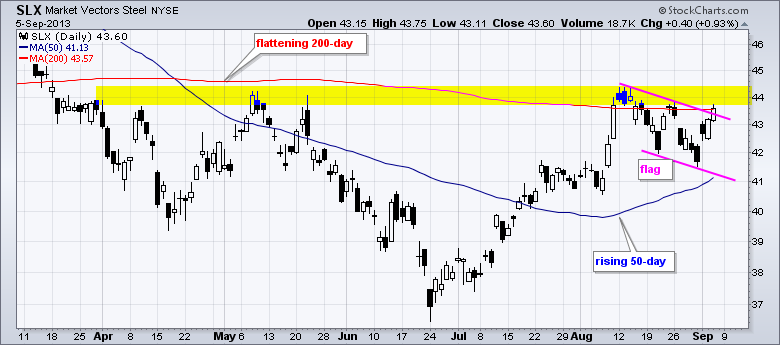
The Steel ETF (SLX) is making some noise with a break above the flag trend line and challenge to the 200-day SMA. This moving average flattened just below resistance, which extends back to the May highs... Read More
Don't Ignore This Chart! September 04, 2013 at 05:32 PM
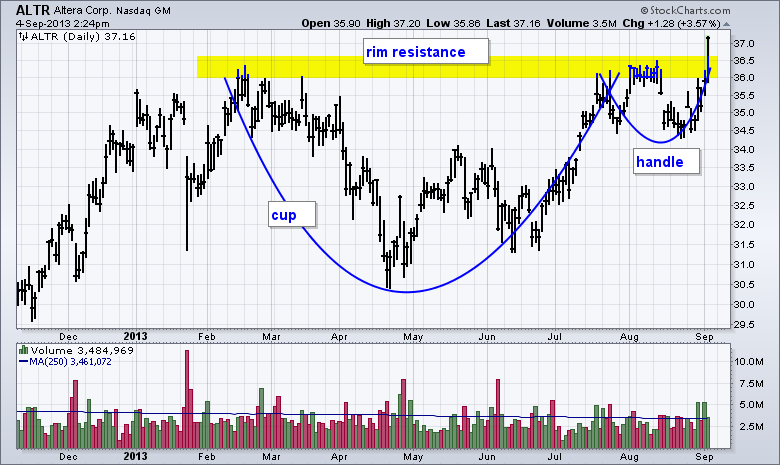
Altera (ALTR) is showing upside leadership with a breakout and 52-week high on good volume. Overall, the pattern at work looks like a cup-with-handle, which is a bullish pattern. The rim breakout completes the pattern and argues for higher prices... Read More
Don't Ignore This Chart! September 03, 2013 at 06:17 PM
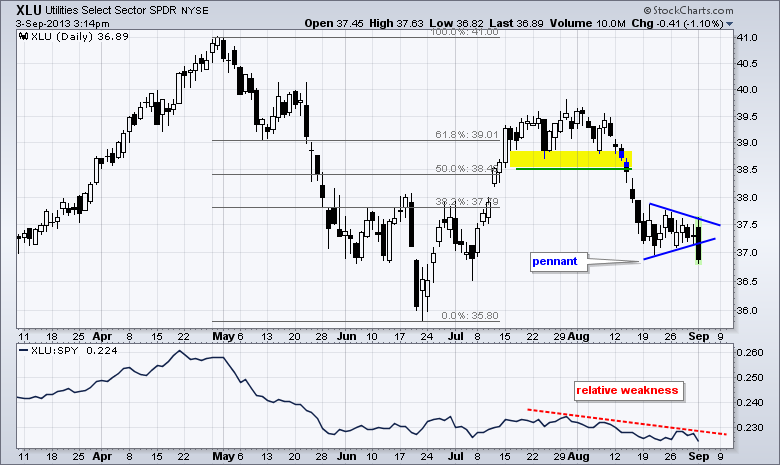
The Utilities SPDR (XLU) broke down as the 10-year Treasury Yield ($TNX) moved back above 2.8% on Monday. XLU was already in a downtrend after the lower high in July and mid August breakdown... Read More