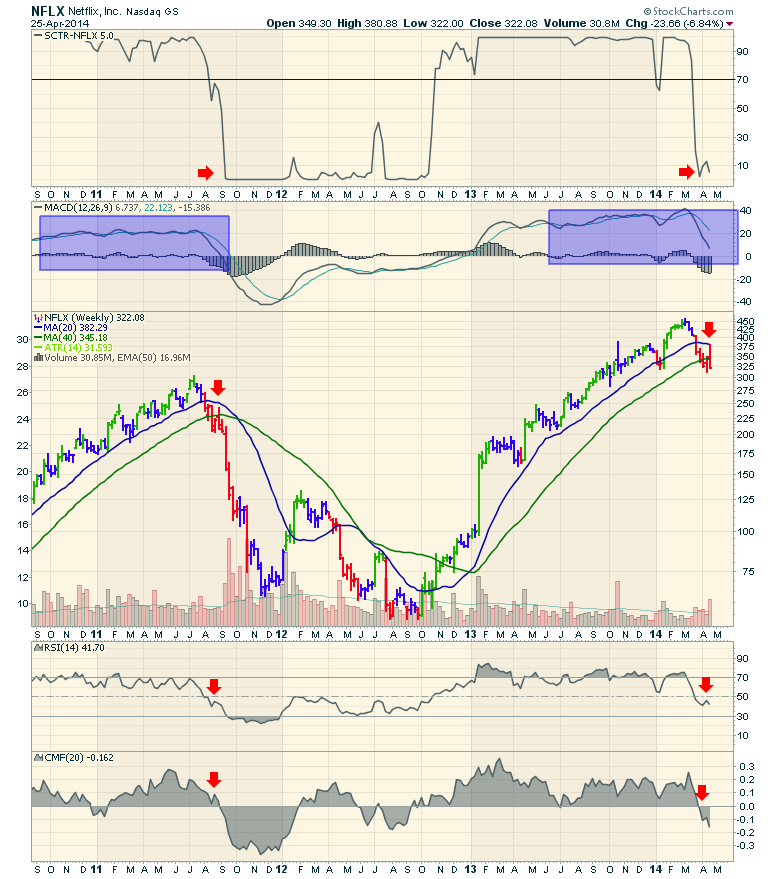
Netflix has been a darling for the momentum stock selectors. So on a Saturday night, maybe we should watch a movie on NFLX. When I called up NFLX today, I was in awe at how similar the patterns are looking back to 2011. Have we seen this movie before?
The SCTR had NFLX as one of the top stocks in the market. When it collapsed, it took almost a full year to get back above 70 on the SCTR. The MACD had stayed in a tight pattern back in 2011. Similar pattern in 2013. When NFLX lost support at the 20 WMA, it went down and tested the 40 WMA in 2011 and again in 2014. After finding some support at that level, it bounced back up to the 20 WMA. When it could not hold above, it really let go. Once it crossed below the 40 WMA, the simple rule of stay long above the 40 WMA was broken for a while.
The RSI made a similar pattern at the 50 line. The CMF is actually weaker now than it was back in 2011.
NFLX might be specializing in reruns for subscribers and investors.
Good trading,
Greg Schnell, CMT

