For many investors, the large basing patterns with breakouts are favorites. In the case of Electronic Arts (EA), the stock built a text book consolidation formation at a high level and then broke out. It is commonly called a cup with handle.
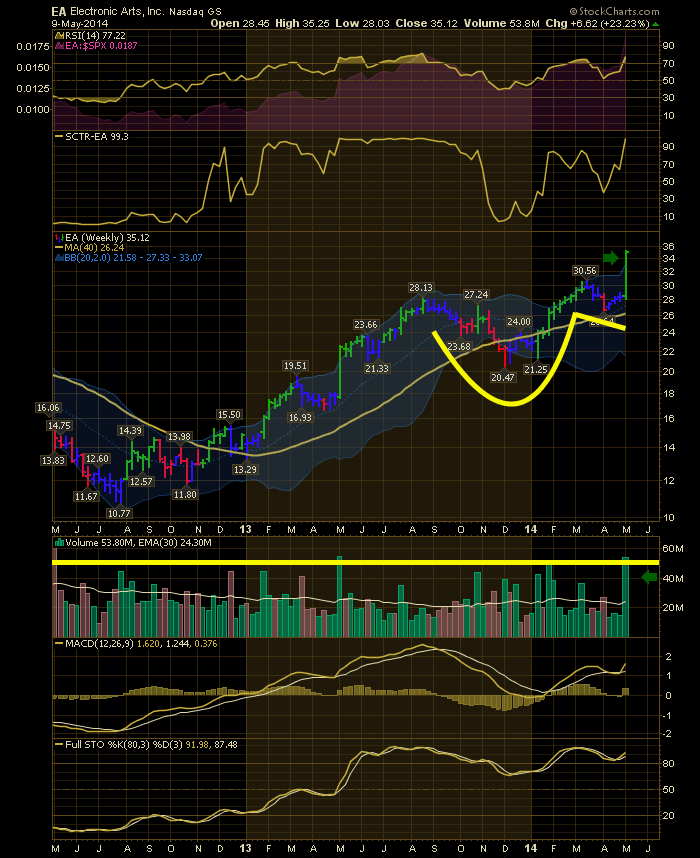
Many investors have heard about cup and handle patterns. This is pretty much a classic.
The stock was in a strong uptrend for a long period of time, rising 100% from August 2012 to August 2013. This is important. It has to be a strong stock to begin with. In September, 2013 the stock started to soften. As it pulled back it formed a rounding base pattern. The stock climbed above $28.13, the previous high, and made a slightly higher high at $30.56. That new high came on high volume in early March. Then the stock started pulling back on lower volume. After having one big down week on a red candle, the next week had almost no volume and the stock traded in a tight range ( very short candle). For the handle area in general, the stock had below average volume almost every week. The sudden plunge the first week of April shook out weak holders of the stock. As it started to rise up, the volume stayed low. Then this week, a big high volume breakout on earnings shot the stock well above all the previous resistance.
Here is a look at the daily.
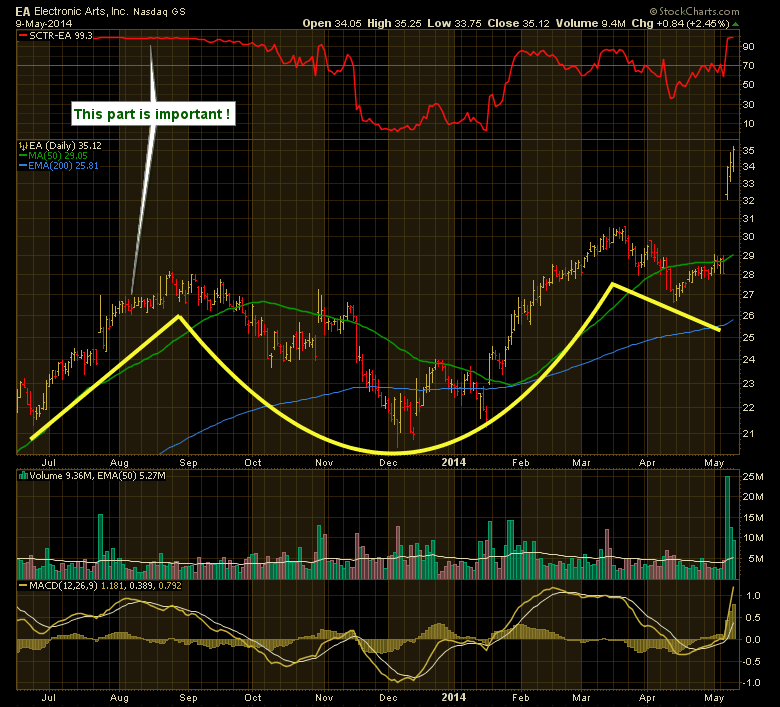
One thing I notice when I look at this stock is how tight the trading candles are from one day to the next. We can see the huge outsized volume candle for this week.
So hindsight is 20/20 and we would have loved to own this stock. However, almost every technical trading website and most growth investing sites suggest not holding through earnings. With the stock resting below the 50 DMA it would have been hard to be bullish going into earnings. On the SCTR we can see the stock was hovering around the 70 level which is a place I love to look at the stock. That might of had some interest. Bottom line, most technicians wouldn't have stayed in this trade or they would have used options to control the risk.
What to do now? Now this stock can be on a watchlist and try to buy it on small pullbacks. There is no overhead resistance and everyone who is in the stock today is very happy to be in it. Small pullbacks will probably be the only entry opportunities.
Good trading,
Greg Schnell, CMT

