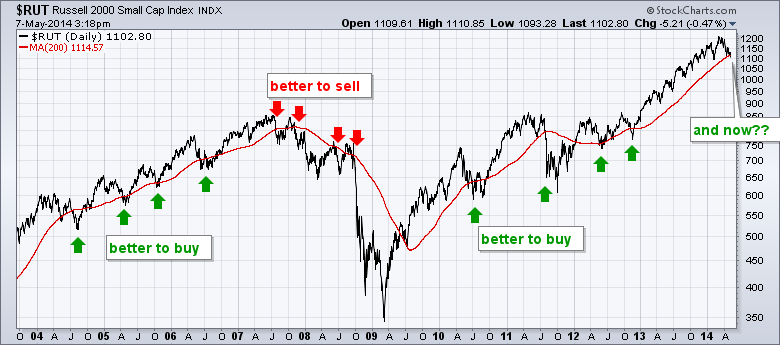
For the first time in over a year, the Russell 2000 closed below its 200-day moving average. This may seem like a long-term sell signal, but it really depends on the bigger trend. Notice how one would have been better off buying on breaks below the 200-day in 2004, 2005 and 2006. Of course, selling on the breaks in late 2007 and 2008 would have saved an investor quite a bit of money and worked out well. The index has been trending higher since 2009 and it would have paid to buy the breaks in 2010, 2011 and 2012. There were no breaks in 2013.
Click this image for a live Chart

About the author:
Arthur Hill, CMT, is the Chief Technical Strategist at TrendInvestorPro.com. Focusing predominantly on US equities and ETFs, his systematic approach of identifying trend, finding signals within the trend, and setting key price levels has made him an esteemed market technician. Arthur has written articles for numerous financial publications including Barrons and Stocks & Commodities Magazine. In addition to his Chartered Market Technician (CMT) designation, he holds an MBA from the Cass Business School at City University in London.
Learn More