Don't Ignore This Chart! June 30, 2014 at 06:13 PM
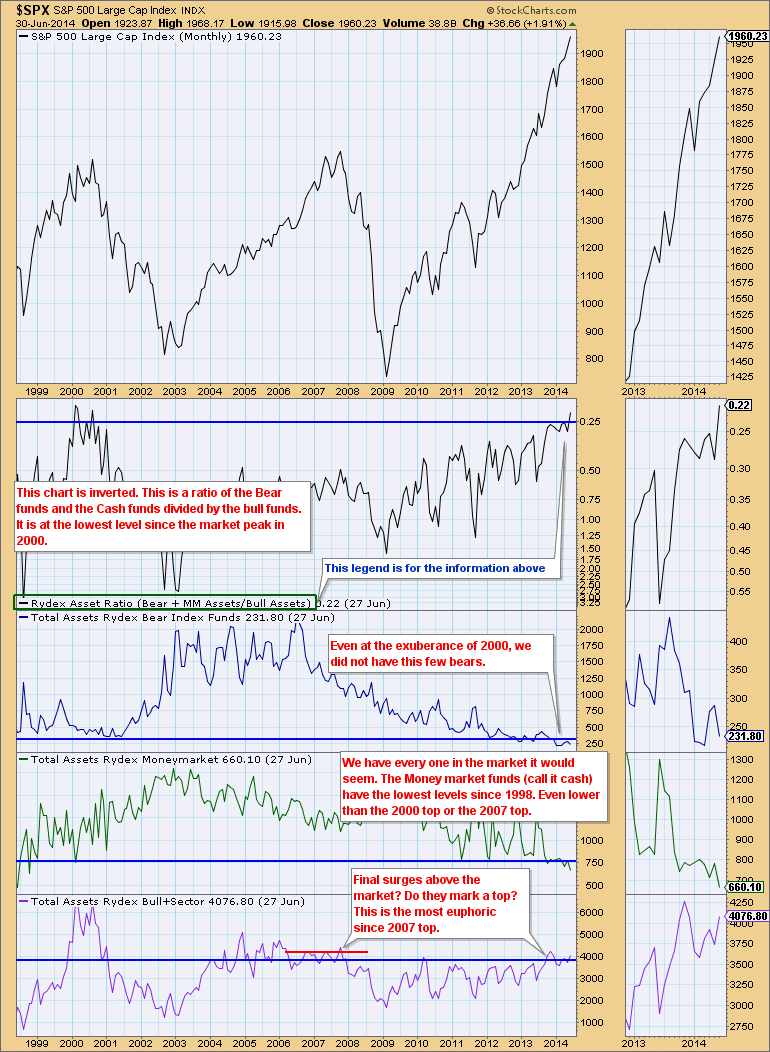
Technical Analysis includes a wide range of indicators. Finding the final peak or valley on a chart is always difficult. When something seems extreme, it can always be more extreme. A good example of unanimous extremes is a mid year look is the Rydex sentiment... Read More
Don't Ignore This Chart! June 30, 2014 at 03:03 PM
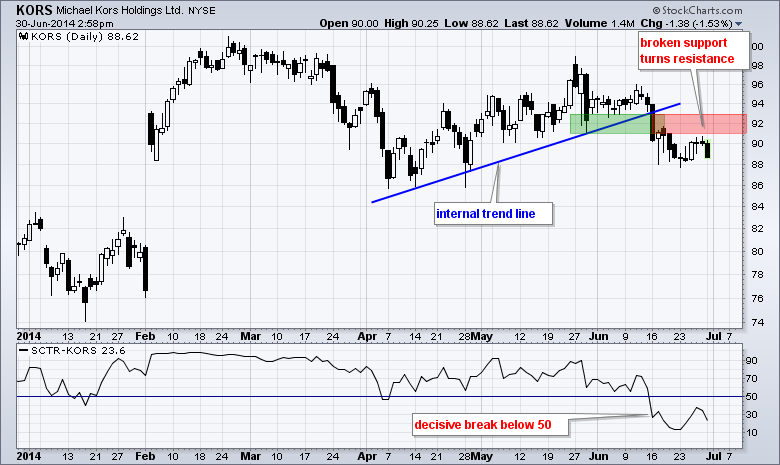
Michael Kors (KORS) led the market in February with a massive gap and new high, but the stock has fallen on hard time in June with a trend line break and relative breakdown. On the price chart, KORS broke the internal trend line and support zone with a sharp decline below 90... Read More
Don't Ignore This Chart! June 26, 2014 at 12:20 PM
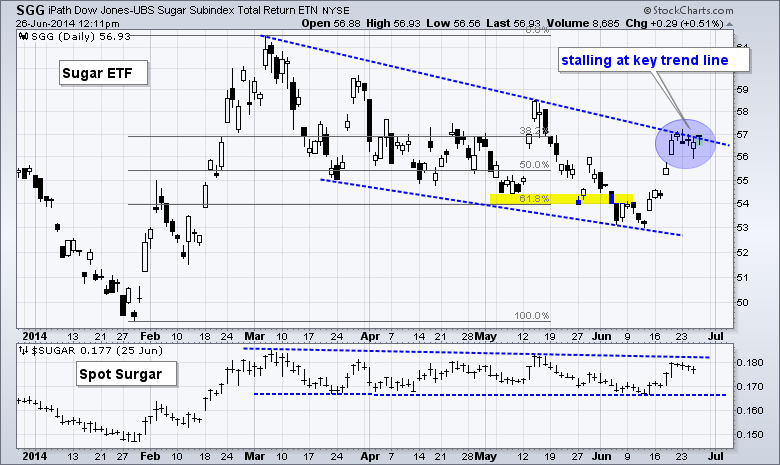
Spot Sugar ($SUGAR) has been in a downtrend for years, but this commodity may be turning the corner with a higher low and falling wedge. The chart below shows the Sugar ETN (SGG) surging in February and then correcting with a falling wedge the last 3-4 months... Read More
Don't Ignore This Chart! June 25, 2014 at 02:59 PM
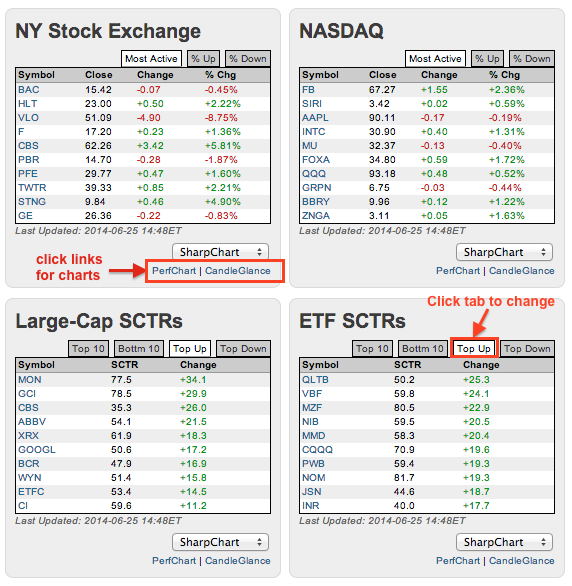
Chartists can find stocks and ETFs on the move using the six tables in the middle of the home page. The image below shows four of these tables: most active Nasdaq and NYSE stocks, large-cap SCTR movers and SCTR movers for ETFs... Read More
Don't Ignore This Chart! June 24, 2014 at 03:26 PM
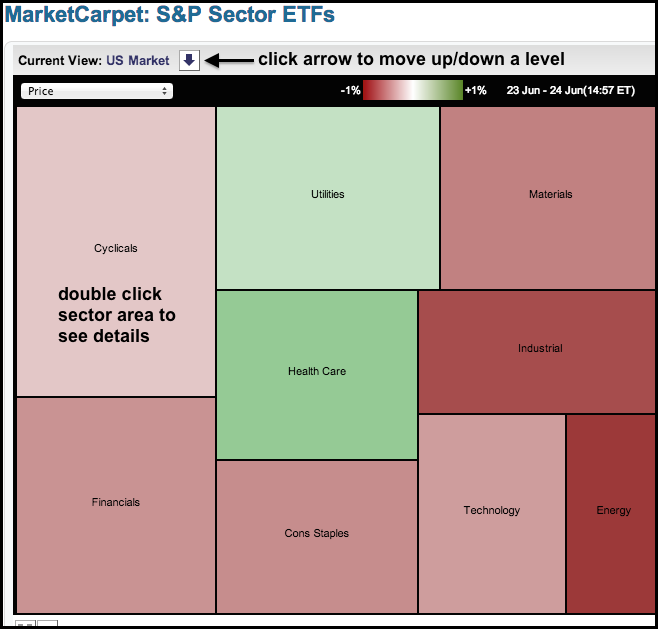
The MarketCarpet for the nine S&P sectors turned mostly red on Tuesday with seven sectors down and just two up. Utilities and healthCare were the only two holding on to their gains in the late afternoon. Notice that energy is the darkest red... Read More
Don't Ignore This Chart! June 23, 2014 at 03:05 PM
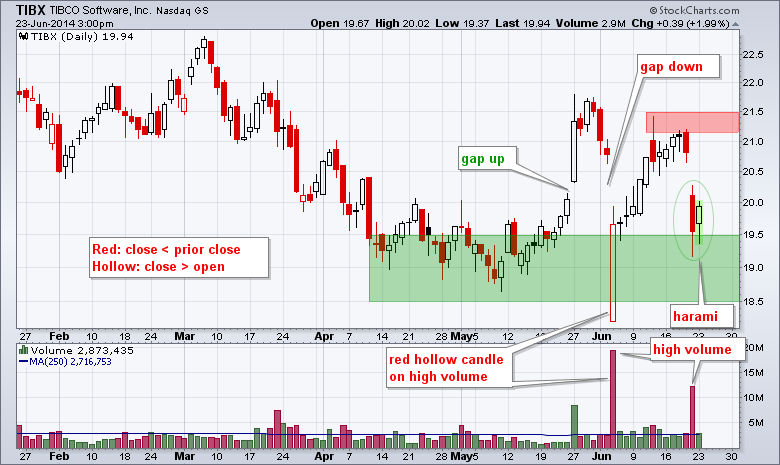
Tibco Software (TIBX) has been all over the place the last five weeks. The stock gapped up in late May, gapped down in early June, bounced to 21 and then gapped down again last Friday. Despite all this volatility, the stock may be at support now... Read More
Don't Ignore This Chart! June 20, 2014 at 12:11 PM
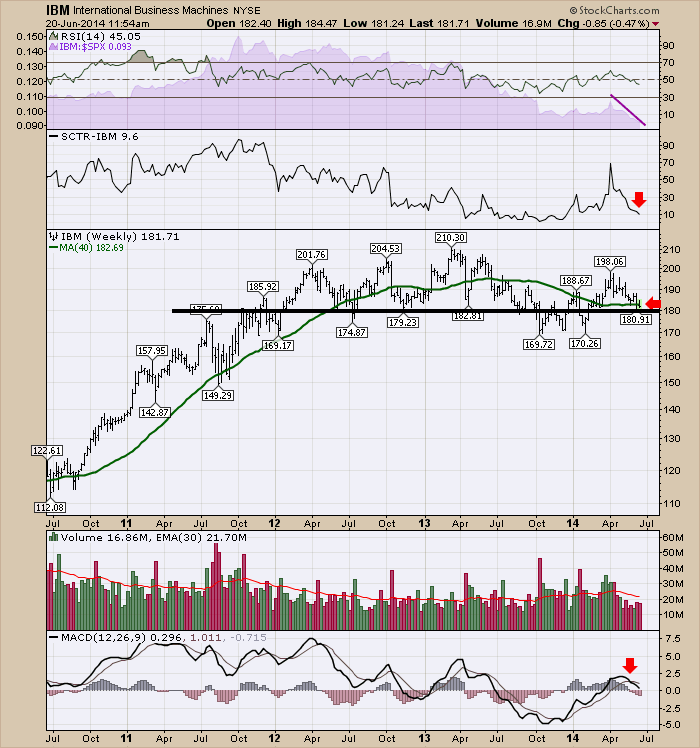
IBM Corporation (IBM) has been struggling over the last 2 years, but IBM surged off the February 5th, 2014 lows and kept climbing till April 1. 2014. The technicals are really poor. IBM is starting to look like a better short than long... Read More
Don't Ignore This Chart! June 19, 2014 at 02:17 PM
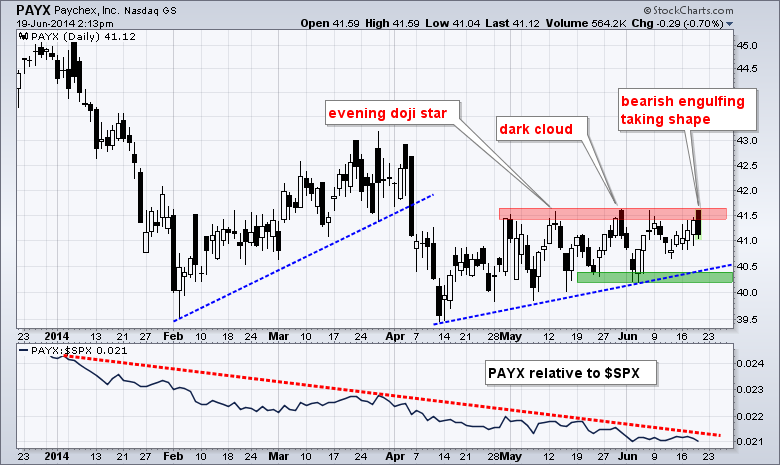
Paychex (PAYX) is having all kinds of problems breaking through resistance in the 41.7 area. A bearish engulfing is taking shape today and this is the third bearish candlestick reversal pattern in six weeks. The late May and early June lows mark support in the 40.2-40... Read More
Don't Ignore This Chart! June 18, 2014 at 12:25 PM
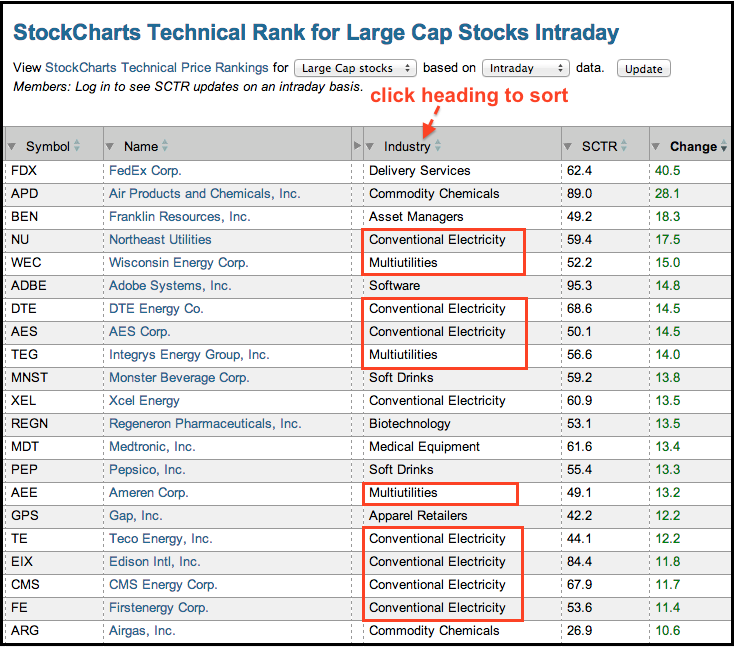
The utilities sector is on fire Wednesday with several stocks sporting big gains in their StockCharts Technical Rank (SCTR). Northeast Utilities (NU), DTE Energy (DTE) and AES Corp (AES) have double digit gains in their SCTR... Read More
Don't Ignore This Chart! June 17, 2014 at 03:40 PM
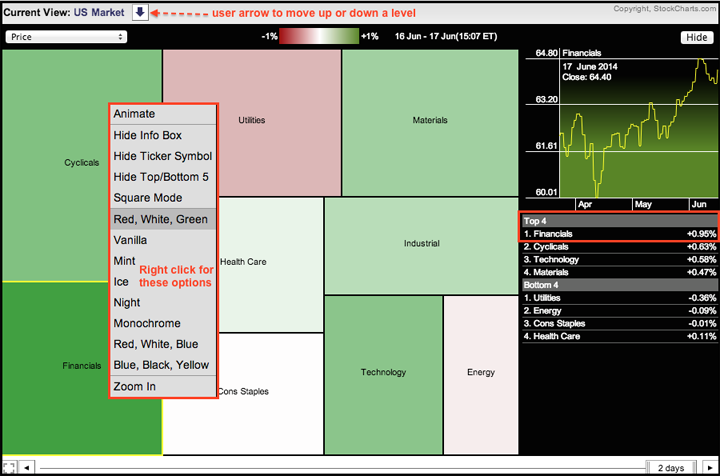
The Sector MarketCarpet shows the Finance SPDR (XLF) catching the strongest bid because it is the darkest green. The Utilities SPDR (XLU) is the weakest with an average loss of .36%. Hover over the carpet and right click to see formatting options... Read More
Don't Ignore This Chart! June 16, 2014 at 11:58 AM
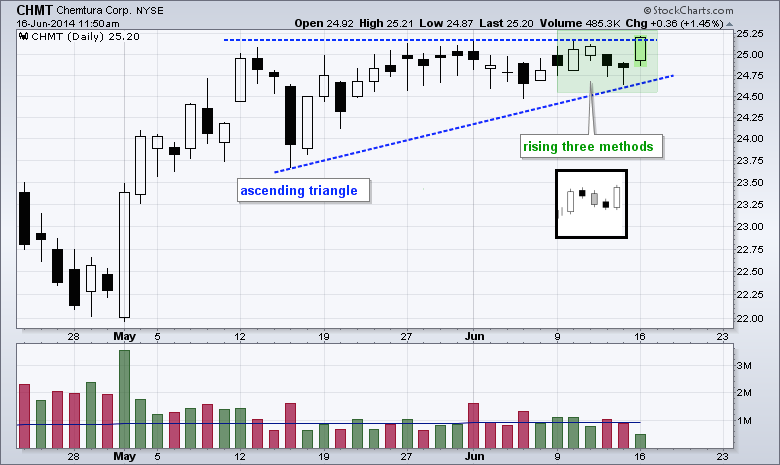
The Rising Three Methods candlestick pattern is a bullish continuation pattern with four candlesticks: a long white candlestick, three candlesticks with small bodies and a long white candlestick that signals a continuation higher... Read More
Don't Ignore This Chart! June 12, 2014 at 03:40 PM
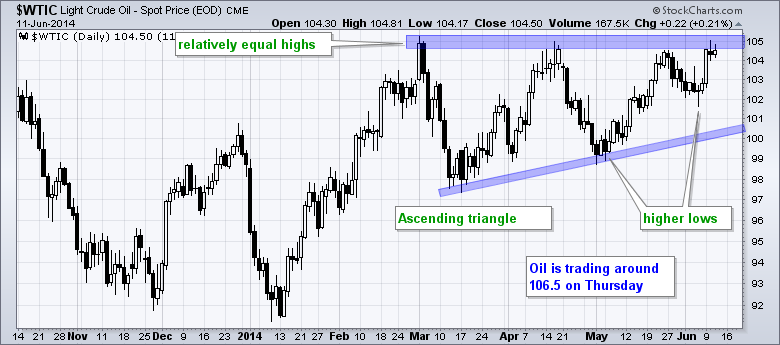
Tensions in Iraq put a big bid into Spot Light Crude ($WTIC) as this key commodity broke above its March-May highs. Overall, crude formed an ascending triangle over the last few months and today's breakout signals a continuation of the January-February surge... Read More
Don't Ignore This Chart! June 11, 2014 at 04:13 PM
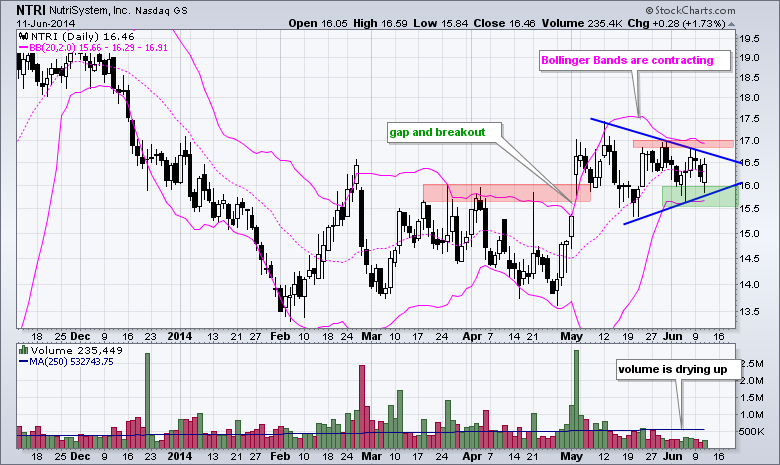
Nutrisystem (NTRI) broke out with a big gap-surge in early May and then consolidated with a triangle. The gap and breakout are largely holding as volatility contracts. Notice how the Bollinger Bands narrowed and volume dried up over the last few weeks... Read More
Don't Ignore This Chart! June 10, 2014 at 03:20 PM
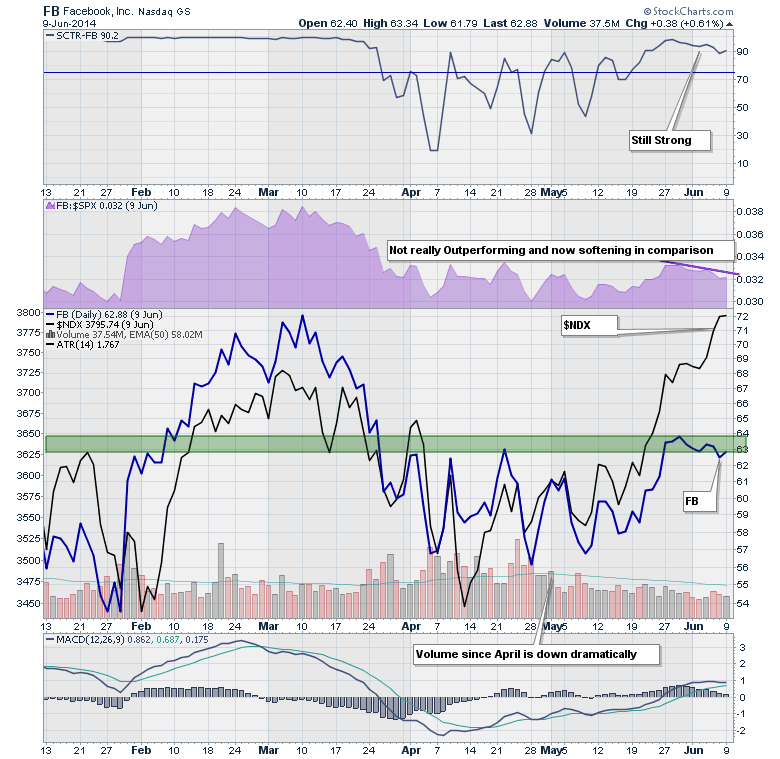
Recently Facebook (FB) has gone sideways. Unfortunately, the rest of the market has gone higher. This gap between Facebook and its peers is becoming more and more noticeable. The SCTR ranking is still very high. The S&P 500 ($SPX) relative strength is dipping in June... Read More
Don't Ignore This Chart! June 09, 2014 at 08:19 PM
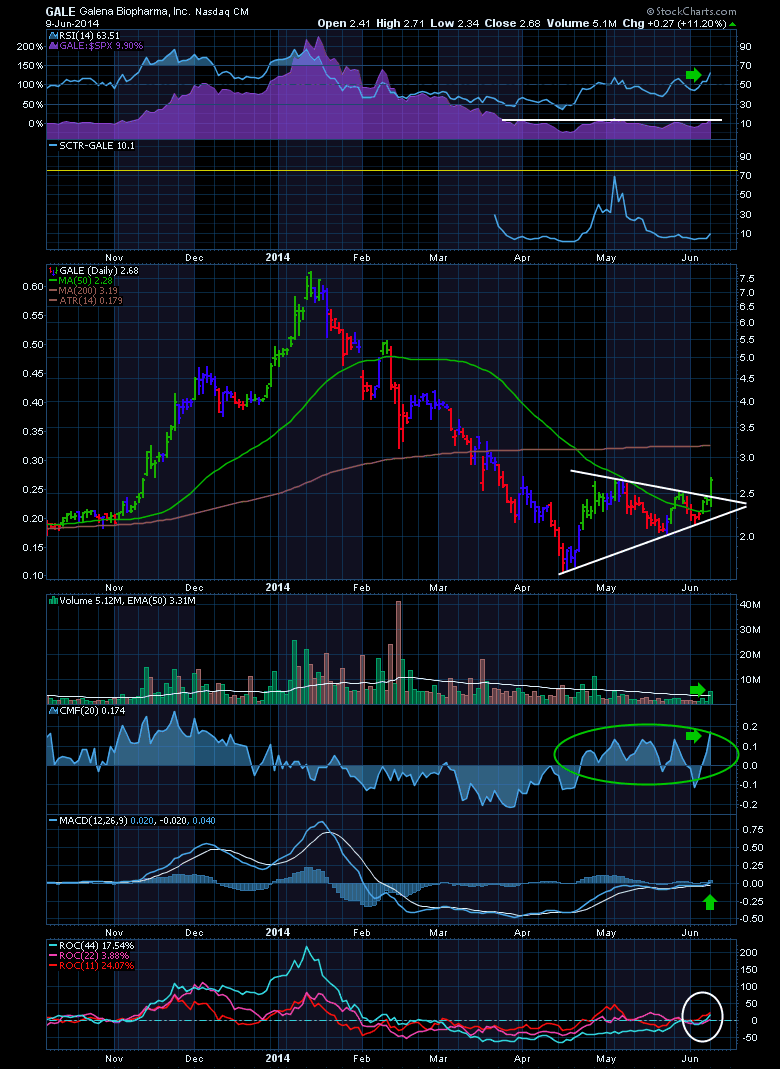
Galena Pharmaceuticals (GALE) is an interesting chart right here. The Relative strength in purple compared to the $SPX has not broken out yet, but everything else is looking very interesting... Read More
Don't Ignore This Chart! June 06, 2014 at 11:20 AM
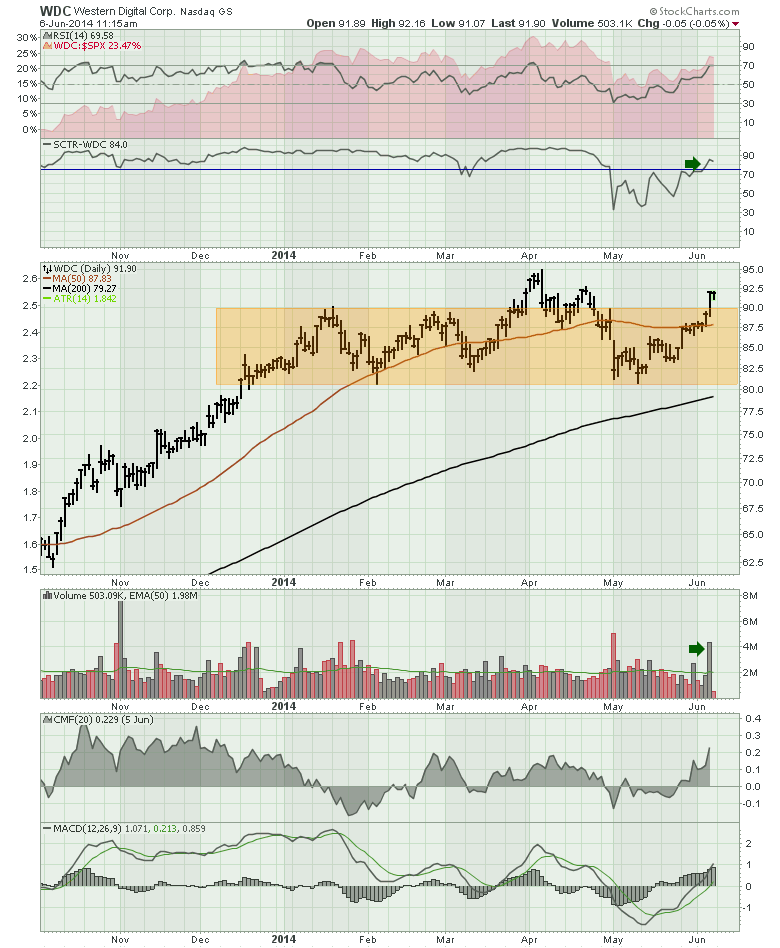
Western Digital (WDC) has been a stellar performer for years. During the recent pullback on high momentum stocks, Western Digital was painted with the same brush and suffered a big pullback to the bottom of a consolidation area built over the last 5 months... Read More
Don't Ignore This Chart! June 05, 2014 at 11:51 AM
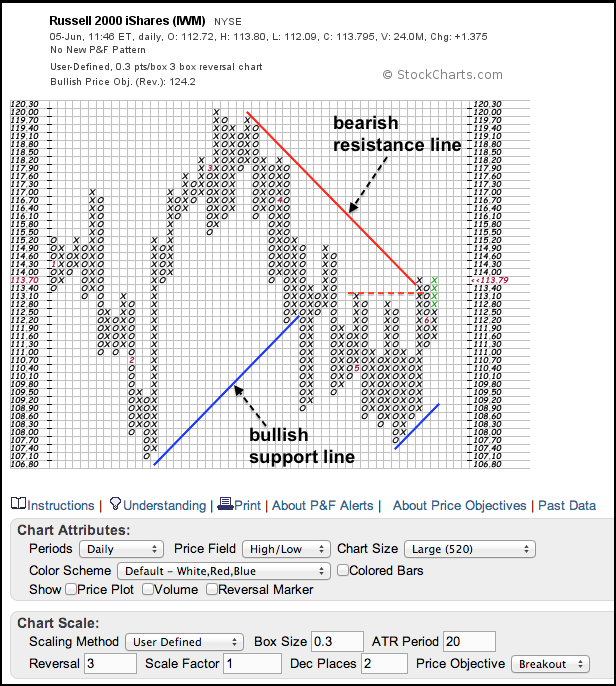
The P&F chart below shows the Russell 2000 ETF (IWM) with 30-cent boxes to capture the medium-term trend. Notice that this chart extends back to January, which is marked by the red numeral 1 in the first column... Read More
Don't Ignore This Chart! June 04, 2014 at 04:01 PM
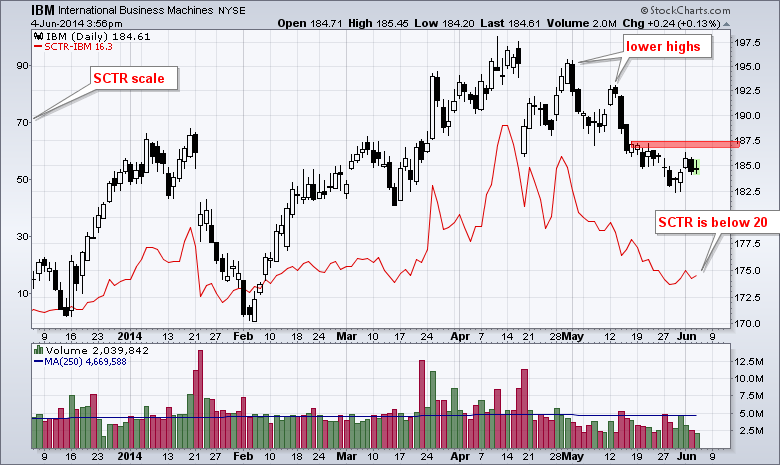
The Dow Industrials hit another new high this week, but IBM did not help the cause and remains well below its mid April high. This means IBM shows relative weakness, which is confirmed by the StockCharts Technical Rank (SCTR)... Read More
Don't Ignore This Chart! June 03, 2014 at 04:00 PM
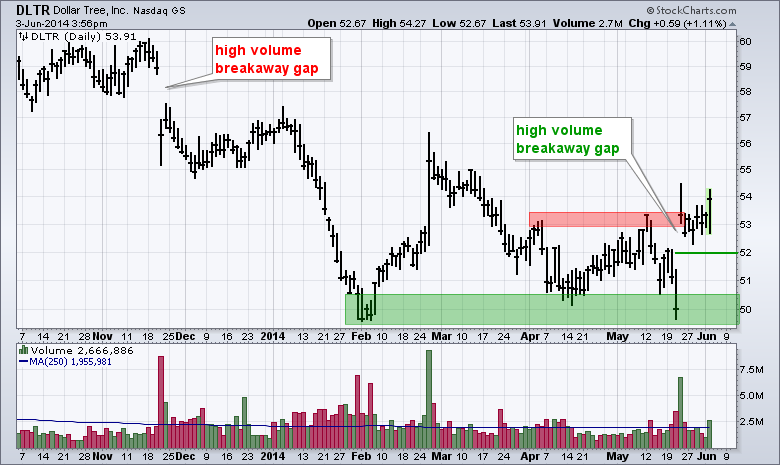
The Dollar Tree chart shows two breakaway gaps in opposite directions. The first breakaway gap occurred in November and started a downtrend. The second breakaway gap occurred in late May and held for over a week... Read More
Don't Ignore This Chart! June 02, 2014 at 04:11 PM
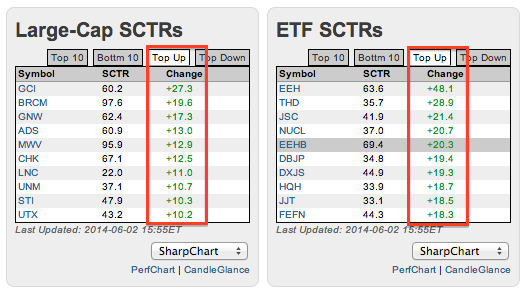
Looking for relative performance leaders? Look no further than the StockCharts home page and the top SCTR movers. The StockCharts Technical Rank (SCTR) tables can be found on the home page near the bottom... Read More