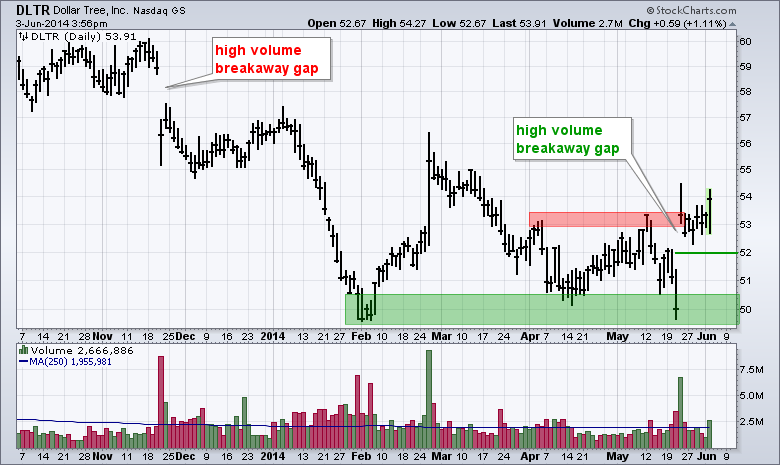
The Dollar Tree chart shows two breakaway gaps in opposite directions. The first breakaway gap occurred in November and started a downtrend. The second breakaway gap occurred in late May and held for over a week. Like the November gap, this gap occurred on high volume and could signal the start of a sustained advance. Last week's low marks first support at 52.
Click this image for a live Chart

About the author:
Arthur Hill, CMT, is the Chief Technical Strategist at TrendInvestorPro.com. Focusing predominantly on US equities and ETFs, his systematic approach of identifying trend, finding signals within the trend, and setting key price levels has made him an esteemed market technician. Arthur has written articles for numerous financial publications including Barrons and Stocks & Commodities Magazine. In addition to his Chartered Market Technician (CMT) designation, he holds an MBA from the Cass Business School at City University in London.
Learn More