Technical Analysis includes a wide range of indicators. Finding the final peak or valley on a chart is always difficult. When something seems extreme, it can always be more extreme. A good example of unanimous extremes is a mid year look is the Rydex sentiment. In March it was ringing the bell as being extreme. Some have gotten more extreme. My comments are unchanged since March.
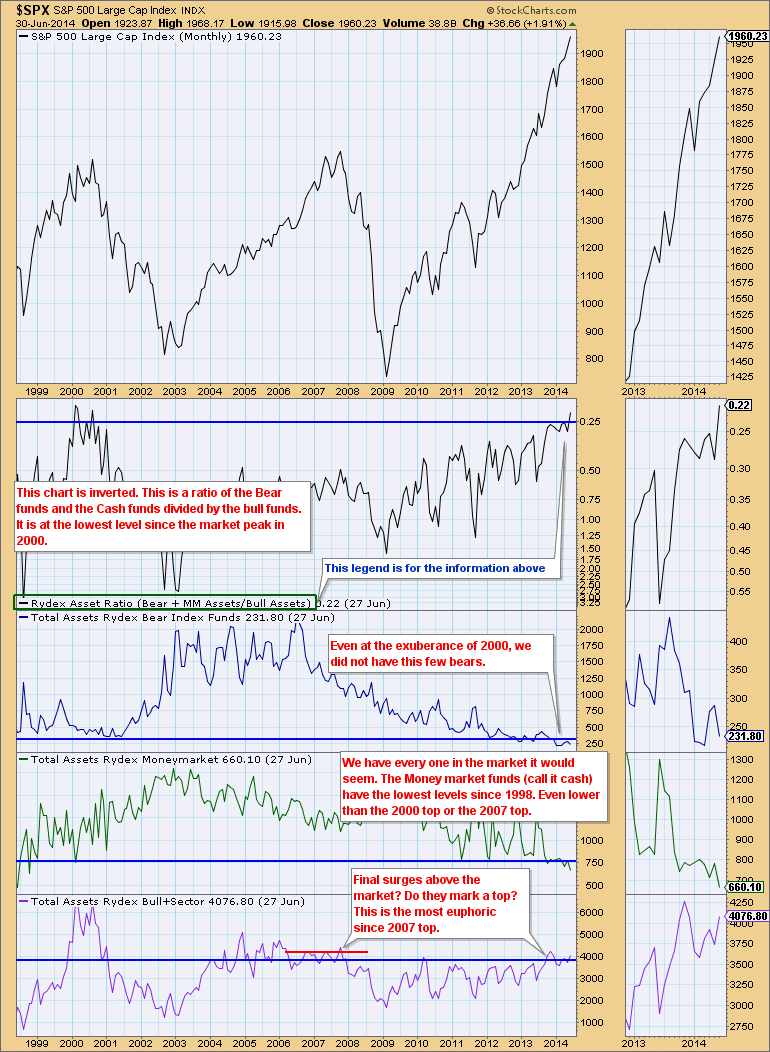
The Top ratio is near the euphoria of Spring 2000 and making new 13 year highs. The bear index is slightly above the 2014 lows on the chart. We can see the Moneymarket has broken to new lows since March. Lastly, the Total assets ratio is wobbling in a tight range that seems similar to the 2007 period.
Just a heads up. Chartcon 2014 has a few spots left. With 12 outstanding speakers, the opportunity to have a dominant technical perspective heading into an exciting fall 2014 should be one of the most significant advantages to attending. You can click here to sign up. Chartcon2014 ... Apparently a few hotel rooms are left, but this is the last week for those. Chartcon2014...Book it now... Chartcon 2014. I don't know if Martin Pring, John Murphy and Alexander Elder have ever spoken at a forum ever. Three world renown technical investment authors at less than the price of any single one. Chartcon2014
Good trading,
Greg Schnell, CMT
