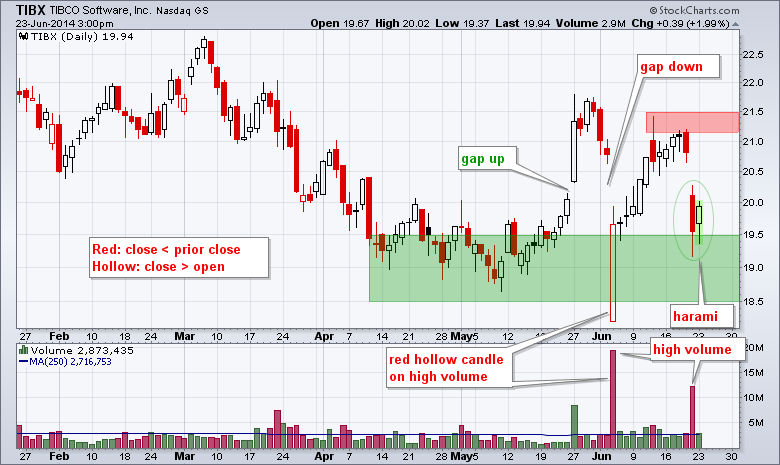
Tibco Software (TIBX) has been all over the place the last five weeks. The stock gapped up in late May, gapped down in early June, bounced to 21 and then gapped down again last Friday. Despite all this volatility, the stock may be at support now. Notice that a rare red hollow candlestick formed in early June. These form when the close is below the prior close, but the close is above the open. Essentially, TIBX opened near the low (18.21) and then bounced to close above 19.5. The high volume day also reinforces the idea of support in the green zone. Most recently, the stock gapped down again last week, but firmed on Monday with an inside day so far. The body of the current candlestick is within the body of the prior and this means a harami could form. Harami signal indecision and this further affirms support in the 18.5-19.5 area. It is a big area, but the bounces since mid April make it so.
Click this image for a live chart
