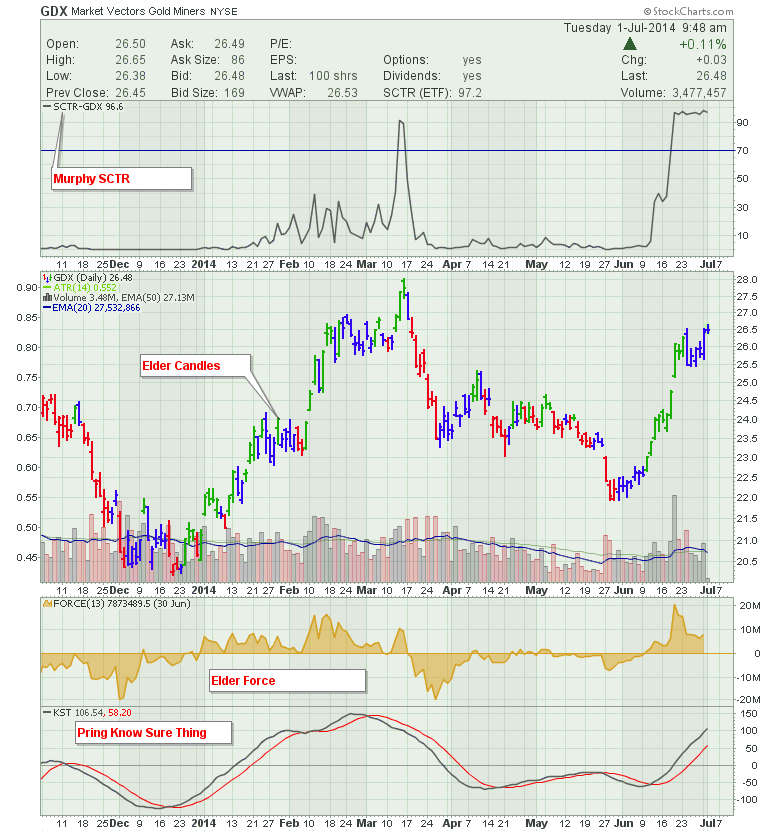
Gold. That shiny metal that is all the rage even when it is on a sell signal! Something caught my eye on the miners and it was that shiny little indicator SCTR.
However, something is pretty compelling on this chart.
All three creators of the these indicators shown will be at the Chartcon 2014 convention in Seattle. Yes, John Murphy, Martin Pring and Alexander Elder are just three of the key presenters at the conference.
But on the StockCharts website recently, there were articles posted in the Market Message for subscribers. The first publication date: May 30, 2014.
"$GOLD LOOKS TO RETEST ANNUAL LOWS IN JUNE... Gold ($GOLD)has not been as weak as Silver, but it continues to deteriorate on Chart 5. With both metals breaking down and the US Dollar ($USD) gaining strength, this needs time. The chart is top left to bottom right. I have highlighted the July lows over the last few years. Notice in 2011/2012 we have a sequence of lows 6 months apart. I have circled the dates of the July and January each year. It has been a remarkably strong turning point.Investors may wish to start scouting which Gold stocks they would be interested in over the next few weeks if they like to invest based on cycles."
Here is the link for subscribers. Market Message May 30, 2014
The second article was:
"THE GOLD MINERS VS. GOLD RATIO FIRES OFF A BIG BUY SIGNAL... The bullish news of the day has to be the breakout in Gold Miner stocks this week. They have really surged. This breakout is a little early based on the January and July cycles over the last few years, but it clearly looks to be jumping here. The ratio of the Gold Miner ETF (GDX) to the price of the gold tracking ETF (GLD) can be a big clue to the breakout.
Today we can see the GLD breakout clearly and the signal given by the ratio, confirming the breakout."
Here is the link for subscribers Market Message June 12, 2014
Here is a link for the June 13, 2014 $SILVER breakout. $SILVER
So GDX looks pretty compelling even today. But more importantly, articles were published in both the free and subscriber portion of the website, helping investors find the next breakout before it broke out and as it broke out. What is also compelling on the chart above is the creators of the charts, the chart indicators and the display functions will all be in attendance at Chartcon 2014. For most investors, the profit moves on these charts have been significant. Alexander Elder teaches methods that help control your risk on entry should the price patterns break down rather than up. In this remarkable conference coming up in Seattle, Chartcon 2014. John Murphy will be there and available for investors to talk about charting in a casual atmosphere. These are not just stage presentations with no opportunity to meet the authors. They will be circulating at all the breaks and events. Martin Pring has brought his expertise to the StockCharts website and the Chartcon 2014 conference as well. This is going to be an outstanding opportunity to mingle with these very personable authors and ask questions specific to your trading. We will also be demonstrating how to use the SCTR ranking in a specific session designed to help you stay invested in the top sectors and industries. Chip, Arthur and I will be available to help investors navigate around all the new features on the StockCharts website. Carl and Erin will be there to guide you through the huge number of indicators introduced by DecisionPoint which is worthy of a conference in itself.
If you want to improve the investment returns on your portfolio between July 1 and December 30, 2014, a good way to start is to invest in better information, better styles of investing and stronger stocks. Chartcon 2014 will be a major cornerstone on the road to finding value in StockCharts website. Don't let the low price of the conference fool you. Chartcon 2014, August 8 and 9, 2014 in Seattle Washington. If you need help getting organized on the StockCharts website, for portfolio managers and CFA's, Chartcon 2014 will be a huge factor in helping you. We had tremendous feedback from attendees of SCU 102 for exactly that purpose. Chartcon 2014.
The three pillars to StockCharts are timely information, tools, and education. Chartcon 2014 goes a long way to tying this all together if you have not streamlined your workflow through the entire website. I would like to encourage you to book this week so we can finalize numbers soon.
Good trading,
Greg Schnell, CMT
