Rolling through the sector ETF's I noticed something that was way,way out of scale. Here is the one year daily chart of the Consumer Cyclical(Discretionary) sector SPDR (XLY).
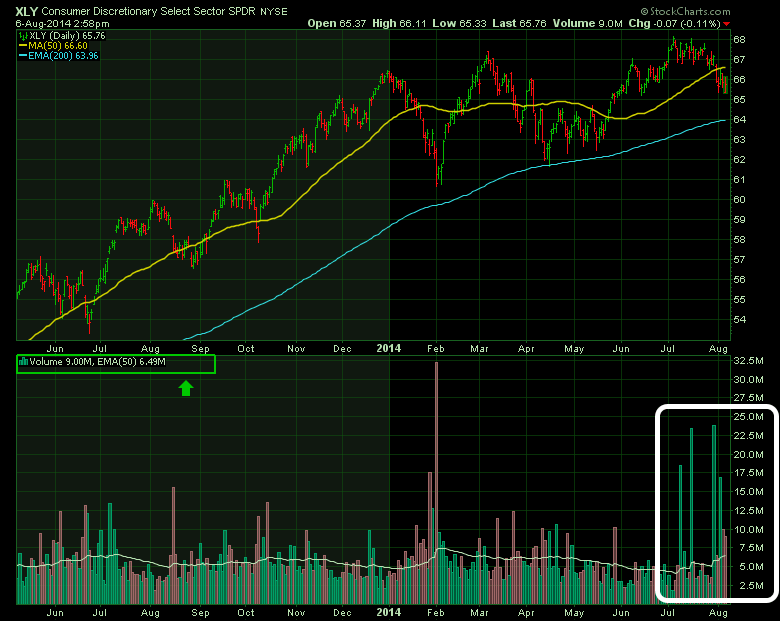
Look at the volume profile for the month of July. While the market was still near to the all time highs, all of a sudden some massive volume candles came in. 4 days inside 4 weeks that closed higher than the previous day and three of the top four largest volumes for the year. The four candles accounted for 83 Million shares and in June the average volume was below 5 Million a day. I want to zoom in and discuss the price action on those 4 days.
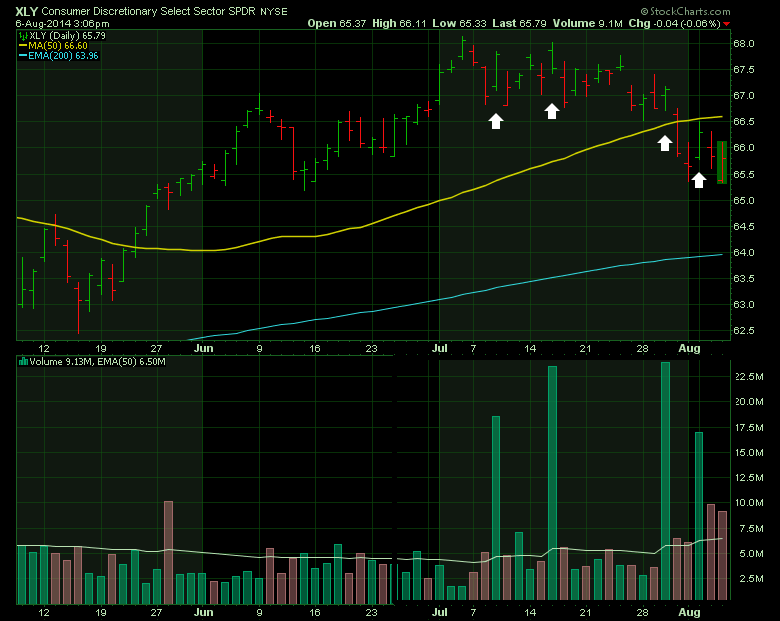
Day 1(Wednesday July 9). 2 days off the all time high (ATH), A huge volume surge steps in and pushes the market up but not to new highs. Largest up day volume in 52 weeks.
Day 2(Wednesday July 16). The ETF gaps up on the open above most previous days, trades lower all day on even higher volume, and still closes above the previous day. A new largest up day volume in a year.
Day 3(Wednesday July 30). The ETF gaps up on the open, trades in a small range on massive volume, and manages to close above the open and the prior close. A new largest up day volume in a year.
Day 4(Monday August 4). The ETF gaps up slightly on the open and stalls under the 50 DMA. Cannot get above the highs from 2 days prior even on 3 x average volume. 4th largest up volume day for the last year.
This massive volume can only be by institutions and my interpretation is that they were forcing the gap open, selling into the bullish appearance and holding the stock in a range while selling into the intraday rally. This is a potential critical event as major volume usually precedes major price moves. XLY is a very important sector and I wrote another article about why it is seasonally important back in June. Click here to read the June 2014 article XLY . XLY may set up a right shoulder here, but this massive volume should be watched as a major turning point. My interpretation would be some institutions were trying to exit huge share positions. We'll find out in the fullness of time if it was a major turning point. The average volume is up 25% in the last 6 days.
It has my focus.
Good trading,
Greg Schnell, CMT
