I did a presentation for a chapter of the CSTA back in July. At the time, Goldman Sachs (GS) was mired below the 40 WMA. I like to use Goldman Sachs as a warning bell. If the deal makers are below their 40 WMA, we can probably expect the overall economy to be beneath the longer moving average not far after. Well, good ol' market ($SPX), ignored Goldman's move down. Another failed clue about banks smelling danger first. But more importantly, Goldman Sachs looks to do a $180 this week. Why is that a good thing? Well, Goldman Sachs has struggled at the $180 level since the financial crisis kicked stocks in 2008. Here is the longer chart. We can see the Lime Green line has kept Goldman away from higher highs. Looking at the times when Goldman Sachs was below the 40 WMA was usually a good time to be cautious. 2010, 2011, 2012 all had GS below the 40 WMA. With the RSI breaking above the down trend this week, and the MACD bouncing off the zero line, things are looking more positive for the broader picture. The weak Relative Strength shown in the shaded purple area chart is a concern. But the dip below the 40 WMA looks to have been a false dawn.
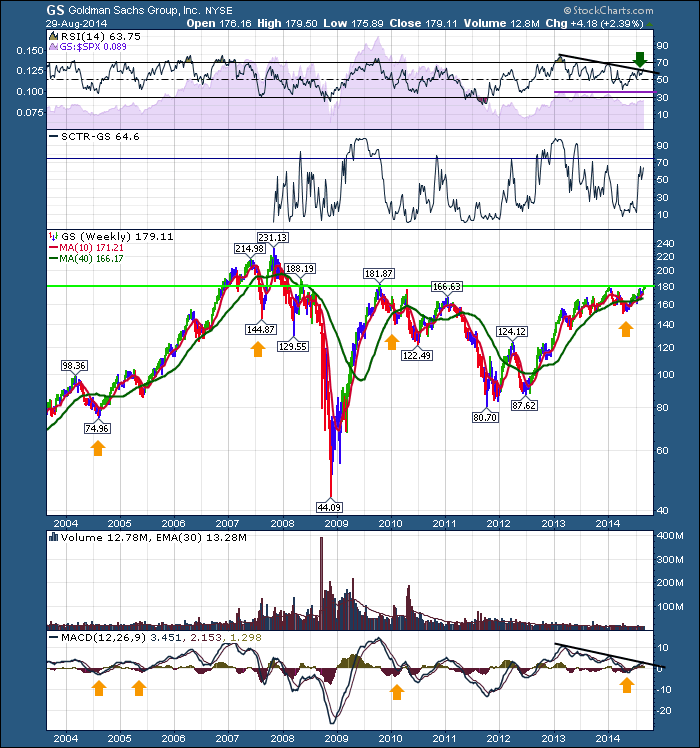
So Goldman is testing 180 this week. Its a good place to watch for GS to "break out and hold" or "fail the test of $180 and do a 180" at $180. Goldman has not spent a month above $180 since the start of the financial crisis in 2008.
Here is a link to the chart for my presentation chart back on July 28. CSTA presentation
Here is a link to a Morgan Stanley (MS) article on this blog a week ago. Morgan Stanley
Morgan Stanley broke through to new highs above an old ceiling at $33.50 this past week. I would expect Goldman to do the same. That bodes well for the market if they are making higher highs through long term resistance. If my July 28th chart was right and this is a head/shoulders base, the target would be $210 which is near 2 of Goldman's 3 peaks in the tumultuous top of 2007.
Good trading,
Greg Schnell, CMT
