After a fantastic Chartcon 2014 conference with technicians, we are all fired up to find the best stocks with the best tools. With all of the attendees travelling from multiple countries and continents, looking at Priceline (PCLN) seems only fitting today.
Dick Arms created a new style of candle that includes volume but also builds on the intra day trading range. StockCharts launched this new candle style last fall and Dick took a seat in the middle of the audience at Chartcon 2014 to walk us through his logic on the candle and why he thinks it is revolutionary and potentially the most powerful charting bar or candle for giving you insight to the power behind the price action and it is displayed on the price part of the chart.
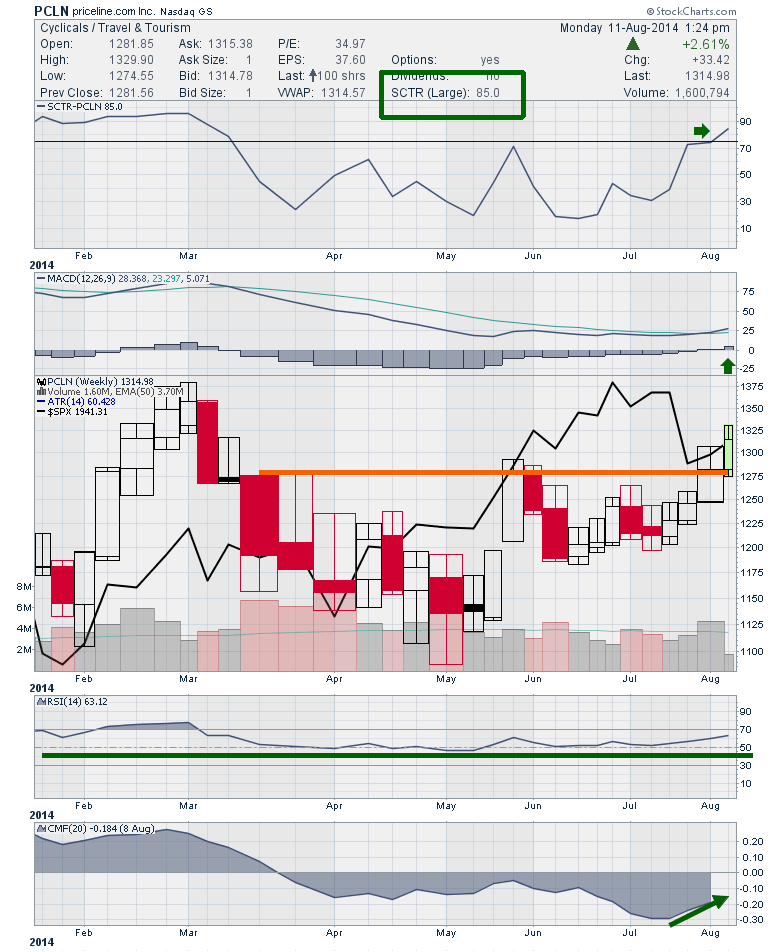
First of all the SCTR ranking has moved into the top quartile for the large cap sector. That is very powerful when we see the candle that pushed the SCTR into a top quartile ranking. PLCN has also broken above a 6 month base and while the S&P 500 ($SPX) shown in black was pulling back the last few weeks, Priceline continued to the upside. With the broad market rally on Friday, PCLN pushed through resistance on a week with high volume. The candle is very wide and the price is at a critical resistance line. It closed Friday just above previous weekly close resistance. What makes this CandleStyle so compelling is it really shows how big a week it was for PCLN even though it did not close the week at the highs. The volume has been rising week to week without looking at the volume bars below. Some of the indicators below confirm the price action as the 20 week CMF is seeing improving money flow, and the RSI is still in bull mode.
Normally I would not post the volume the old way under the candles with this Arms CandleVolume chart, but in this case, the width of the candle on the price is important when you see the price opened on the low of the week and on higher volume pushed above resistance. This candle width displayed to the top of the trading range makes the candle look huge. Without the box width, it would have looked relatively weak. The volume candles below the price do not demonstrate the power in the candle as it looks similar in height to the last few months. (The volume bars below are only wider because of the candle style chosen.) Today's candle is thin because it only has this mornings volume in it, compared to a full week for the other candles. The candle closing out last week demonstrated big volume as it accelerated through previous resistance. Now it is also moving into a top ranked SCTR which is a blend of powerful dynamics with institutional investors.
I realize the price is $1300/ share but there are options available on PCLN so I though it was worthwhile to demonstrate the signal strength from the Arms CandleVolume ChartStyle. By continuing the box width to include the tail and the spire, it puts more meaning on how important the week was in terms of price action. For more information on the Candle style, the ChartSchool article has all the information. You can find it on this link as well. Arms CandleVolume
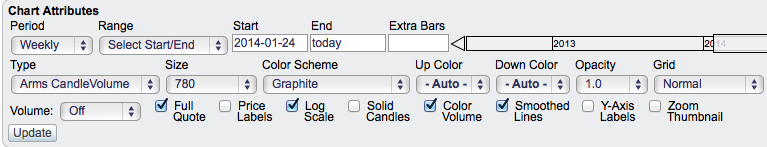
Here are my chart settings where you can see the 'Type' is set to Arms CandleVolume.
Good trading,
Greg Schnell, CMT
