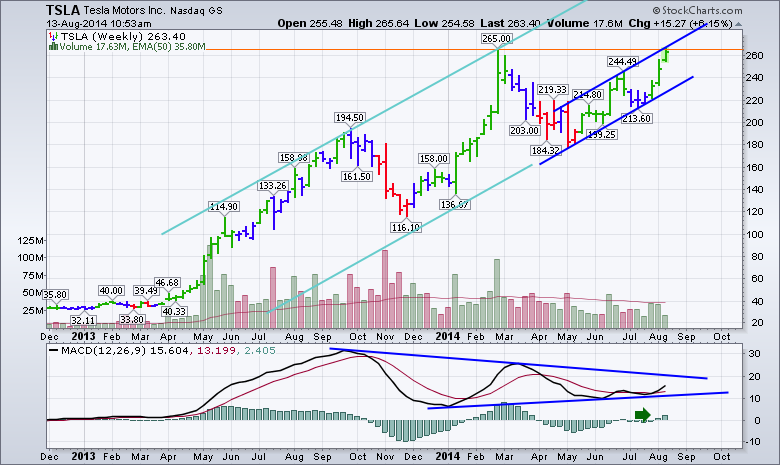
Tesla (TSLA) generates lots of discussion these days. From the Consumer Reports with no door handles appearing to giga factories and new SUV's, the stock couldn't be more in the news. Today, TSLA is testing the thrust high from February 2014 with a peak at $265. It has made a new high as the Open, High, Low, Close information has $265.64 as the daily high. Five things make this chart compelling to analyze at this point. The small channel, the large channel in light blue, the recent cup with handle, the potential double top, and the MACD turning higher.
While the stock is clearly in an uptrend, let's comment on each one of these.
1) The small channel would appear to be about 1/3 of the larger channel. If Tesla respects this dark blue channel line, we could expect a pullback to $240 or the lower channel line. Having the two trend lines (Horizontal resistance and channel resistance) suggests this area might be more difficult to get through but the lower channel is only 10% down from here.
2) The wider channel in light blue has three touch points on the top and the recent uptrend since May is on the same slope creating a nice large channel for TSLA to move within. Bullish potential exists.
3) The Cup with Handle pattern. February top, May low, June high is the cup, July low is the handle. This is an ok pattern, but we would like to see the breakout above the $244.49 high on big volume. The breakout week was less than the 50 Week average but the two strong weeks together look more compelling. The three week base in the handle had one week with the smallest volume going all the way back to the initial breakout in May 2013. The volume drying up in the handle is very bullish! The surge in volume as it rises from that quiet week is very good.
4) The potential double top is always a hurdle, but it is also just a place every chart of higher highs has to get through. At this point the green Elder candle suggests be bullish or stand aside, but you can't go short unless the candle turns blue on Friday. Friday is Options Expiration day to close the weekly candle so that may make the final candle information more volatile as the options market changes to a new month. Dr. Elder reiterated his system at Chartcon 2014 with fabulous charts and commentary that make the candle style valuable for all who use multi time frame signals. At this point everything is bullish and TSLA will probably track the main indexes higher if the indexes can make new highs over the next few weeks.
5) The MACD lines have recently turned up and this recent histogram stack is larger than the late June Stack above zero, so that is positive and bullish. Dr. Elder uses the histogram stack as a major clue for timing. One major concern is the lower high on the MACD line at the February high. If the current price stalled here and the histogram closed the week smaller than the previous week, I would be very cautious about remaining long or at least be protected through options on TSLA. Lower highs on the MACD and weaker histogram stacks as the stock makes higher highs is usually the scale of divergence that marks significant tops. All that to say, this is a pivotal point for TSLA to break higher and hold the higher highs as a Tesla takeoff!
At this point it would be prudent to watch price action closely for both TSLA and the overall market indexes like the Nasdaq 100 ($NDX) or the S&P 500 ($SPX). Weakness in either would be a reason to protect gains quickly. High momentum stocks can struggle and pull back quickly if the indexes lose underlying support.
Good trading,
Greg Schnell, CMT
