Amazon. One of the largest, most used, unprofitable companies in the internet space. Almost every fundamental metric has failed to hold the stock in reality. It has had a P/E for years with a negative denominator. Technically, Amazon has been equally as hard. The uptrends continue, lots of divergences appear, but the long term trend holds. Well, times they are a changin'.
The chart currently looks to be at one of the most important decision points in the last 5 years. Its SCTR ranking is only 15 which is shockingly low between the back to School, Thanksgiving and Christmas season. Some of the major relative strength trend lines go back to 2007. However, 2 of 3 have been broken this year. First of all, the S&P 500 ($SPX) relative strength line from 2007 to 2014 has been broken. Secondly, the relative strength line compared to the Consumer Cyclical Sector has been broken in 2014. Amazon is still outperforming the broad line retailers in the long runup since 2007 or even the black trend line since 2010. We can see the green area showing under performance all year since January with the small thin line holding a downward slope.
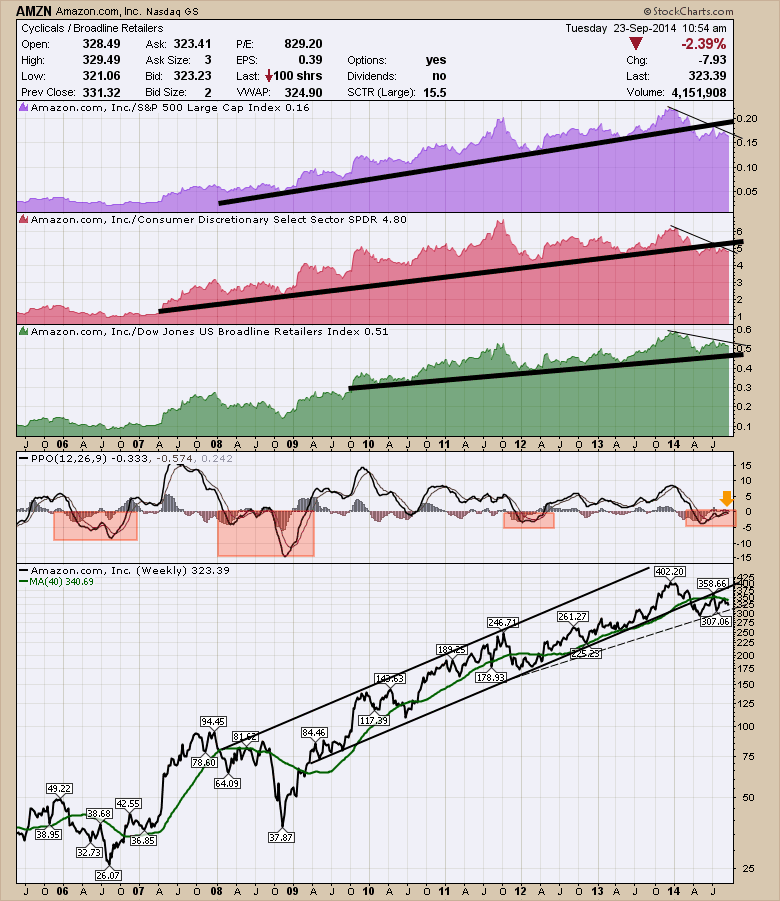
The last two things to notice are the MACD lines and the price action. Currently the MACD is trying to get back above zero. That would be critical in terms of positive signalling. However, in 2008, Amazon's MACD tried to push back above the zero line going into the fall and failed. Currently the MACD looks similar.
Price is also showing signs of fraying support. Amazon broke out the bottom of a five year uptrend in April. Now it is trying to hold support of a shorter trend line. One of the other major issues is the 40 WMA has rolled over and now has a negative slope. A fail at the downsloping 40 WMA and at the MACD zero line would really be bad news. Amazon has tried twice too get back above the 40 WMA. Once in July and just recently.
This is a zone to launch a new gorilla rally higher or fail in a classic style of trend line support breaking and simultaneously would be completing a year long head/shoulders top breaking down. The July high of $312 in 2013 would be the left shoulder. Investors should be quick to protect or exit positions should further weakness develop. A move back above the 40 WMA would probably be a great signal going into the holiday season.
Good trading,
Greg Schnell, CMT
