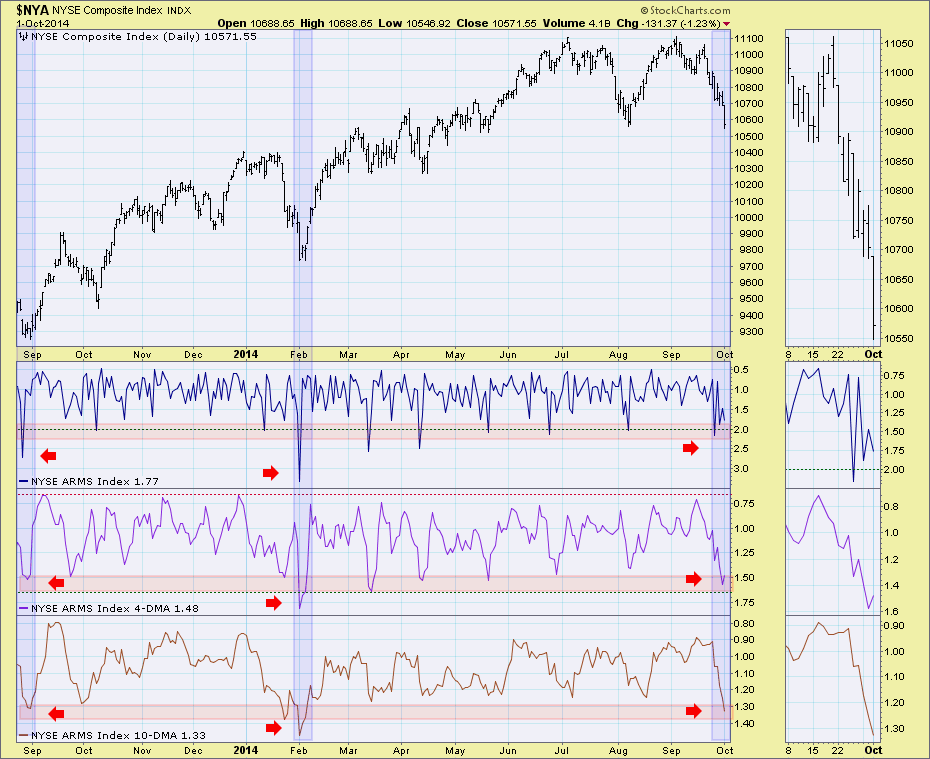
The TRIN or Short-Term TRading INdex, better known as the Arms Index, is a breadth indicator that was developed by Richard Arms in 1967. The index is calculated by dividing the Advance-Decline Ratio by the Advance-Decline Volume Ratio. Because it is an oscillator, we can use it to identify short-term overbought and oversold conditions. Looking at the TRIN chart below, I've identified areas of oversold readings (red bars) and then annotated the corresponding oversold readings with price using the blue bars. I used a reverse scale on the TRIN so it is more intuitive.
I was mostly interested in times when the 10-DMA of the index hit extremely oversold territory and then looked at the corresponding readings in the index and its 4-DMA. The 10-DMA is hitting extremes that we don't see that often, in one year there have only been three extremely oversold readings. Note that the corresponding readings are also in oversold territory. I would've liked to have seen a lower reading in the index itself, but it is still oversold. This chart suggests the market may be ready for a price bottom.
Happy Charting!
Erin
