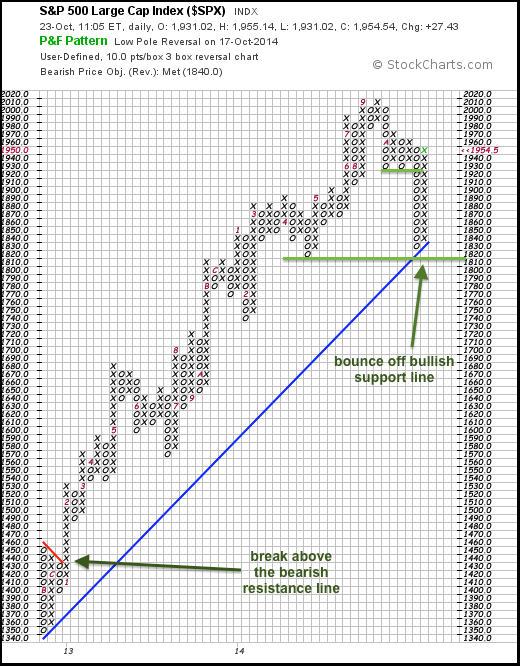
The chart below shows a long-term Point & Figure chart for the S&P 500. Each box is 10 points and a 30+ point move is needed for a reversal (3 boxes). This chart starts with the rally off the November 2012 low. The blue bullish support line was drawn as soon as the X-Column surged above the red bearish resistance line (in November 2012). Rising at a 45 degree angle, this line defines the uptrend until broken. There was had a triple bottom sell signal with the break below 1930, but this occurred above the line and was countered with an immediate surge back above 1930. Support in the 1820-1830 has been affirmed with the October surge and this is the area to watch going forward.
Click this image for a live chart.

About the author:
Arthur Hill, CMT, is the Chief Technical Strategist at TrendInvestorPro.com. Focusing predominantly on US equities and ETFs, his systematic approach of identifying trend, finding signals within the trend, and setting key price levels has made him an esteemed market technician. Arthur has written articles for numerous financial publications including Barrons and Stocks & Commodities Magazine. In addition to his Chartered Market Technician (CMT) designation, he holds an MBA from the Cass Business School at City University in London.
Learn More