Don't Ignore This Chart! November 28, 2014 at 10:46 AM
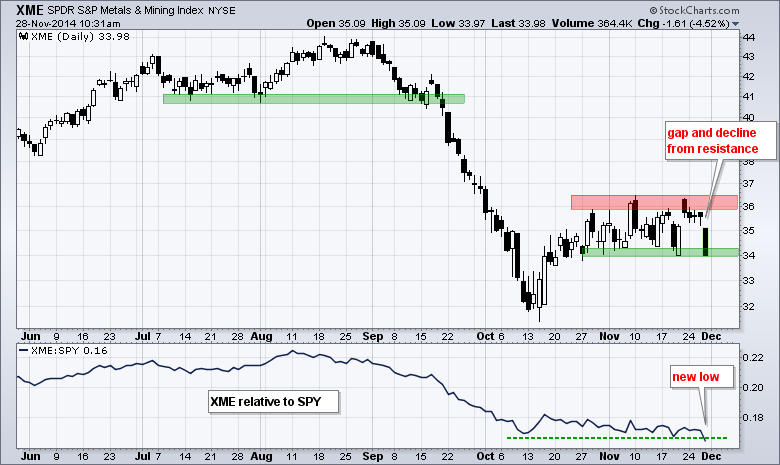
The Metals & Mining SPDR (XME) got a bounce with the stock market in the second half of October, but struggled in November with a trading range between 34 and 36.5. This struggle turned to weakness as the ETF gapped down on Friday and fell sharply... Read More
Don't Ignore This Chart! November 27, 2014 at 10:38 AM
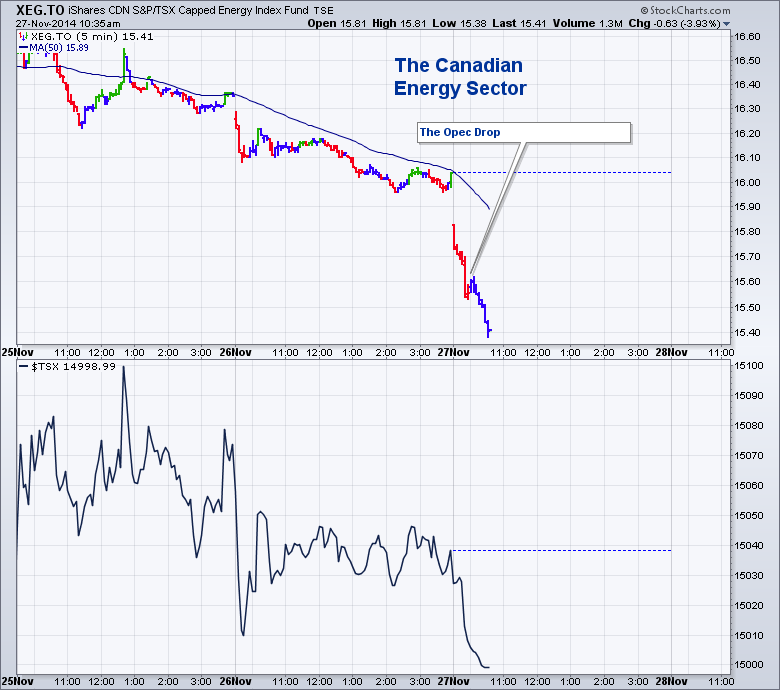
This intraday chart shows the drop on the OPEC announcement. With crude oil down hard into the high $70 level ($70... Read More
Don't Ignore This Chart! November 26, 2014 at 10:04 AM
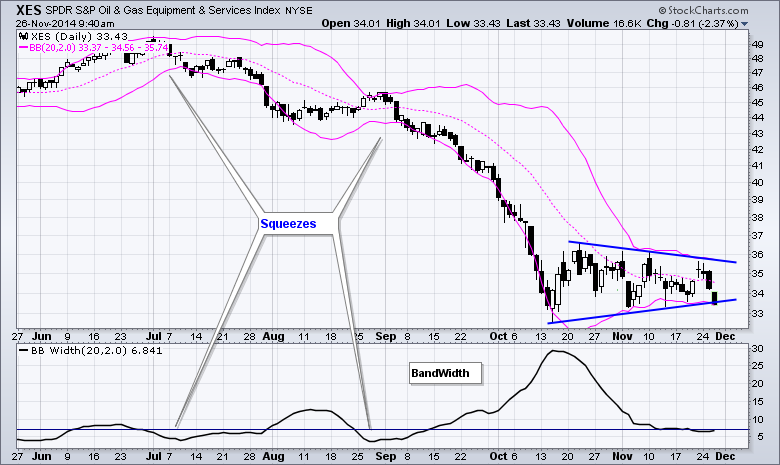
Oil remains weak overall and so do the energy related ETFs (XLE, XOP, XES). The chart below shows the Oil & Gas Equip & Services SPDR (XES) hitting a new low in October and then consolidating with a triangle... Read More
Don't Ignore This Chart! November 25, 2014 at 09:17 PM
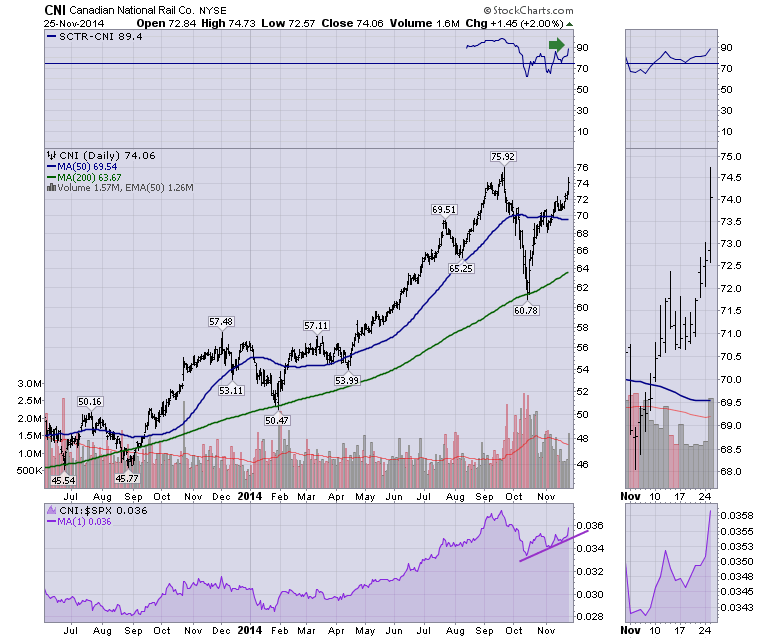
After pulling back in October, all the rails have gone on a major rally from the lows. Canadian National Railway (CNI) is one of the most efficient railways. This particular stock is returning back to some of the highest closes in September before it pulled back... Read More
Don't Ignore This Chart! November 25, 2014 at 04:06 PM
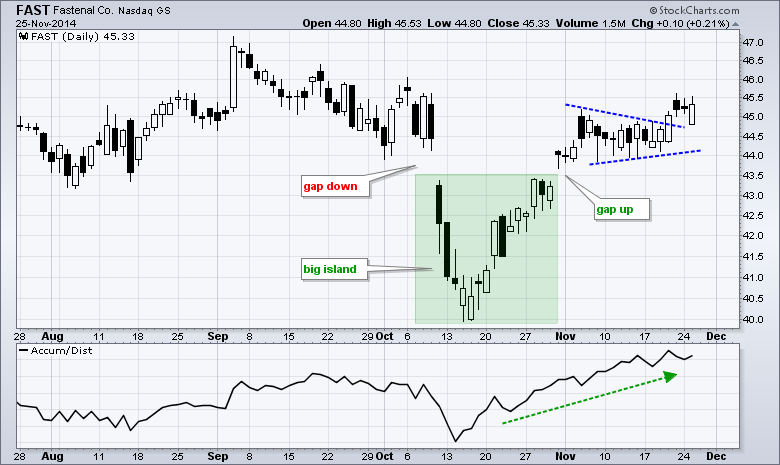
Fastenal continues to improve on the chart with two bullish patterns and signs of accumulation. First, a big island reversal formed at the stock gapped below 43.5 in early October and gapped back above this level in late October... Read More
Don't Ignore This Chart! November 24, 2014 at 10:23 AM
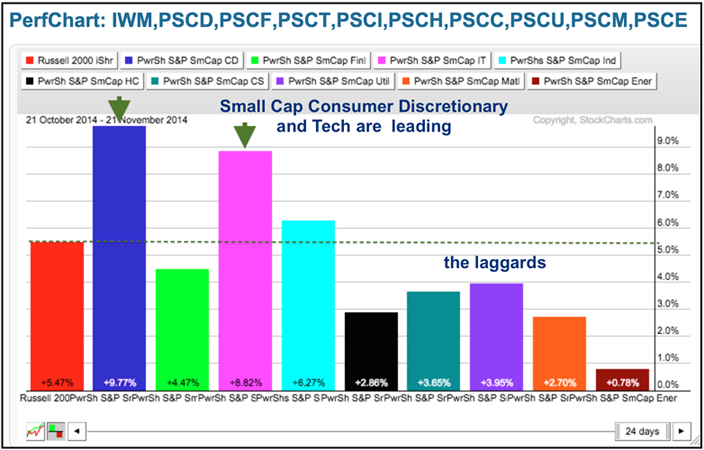
The PerfChart below shows the nine small-cap sector ETFs and the Russell 2000 iShares (IWM). Notice that the SmallCap Consumer Discretionary ETF (PSCD) and the SmallCap Technology ETF (PSCT) led over the last five days with bigger gains... Read More
Don't Ignore This Chart! November 21, 2014 at 12:49 PM
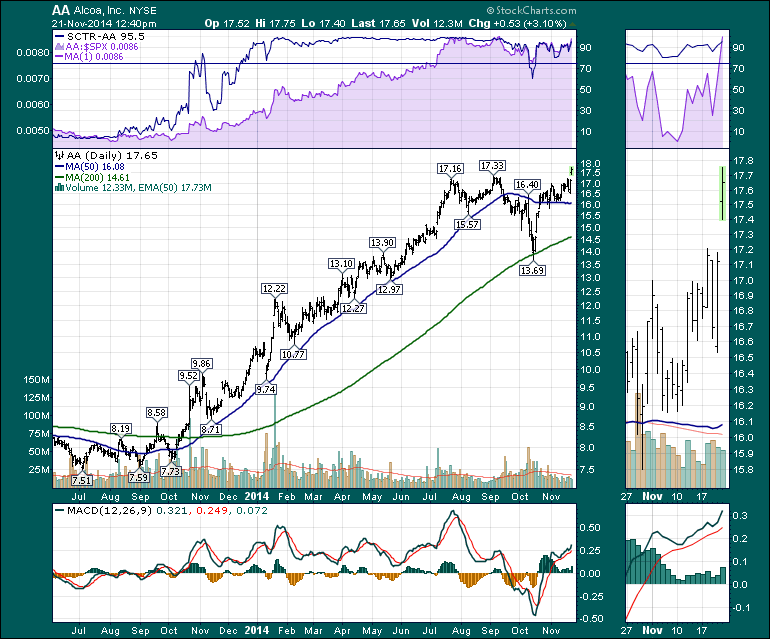
Alcoa (AA) has been a strong stock on the run for a while. Recently it consolidated for the last 150 days. This morning Alcoa pushed to new highs suggesting the consolidation is over. The powerful gap out of the consolidation is nice to see on a very liquid stock... Read More
Don't Ignore This Chart! November 20, 2014 at 12:12 PM
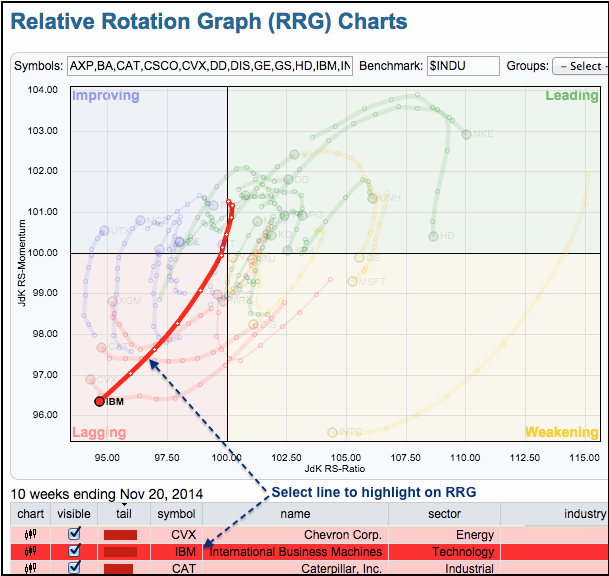
The S&P 500 is up over 7% the last five weeks, but IBM is down and flirting with new lows. The chart below shows the Relative Rotation Graph (RRG) with all thirty Dow stocks... Read More
Don't Ignore This Chart! November 19, 2014 at 11:17 AM
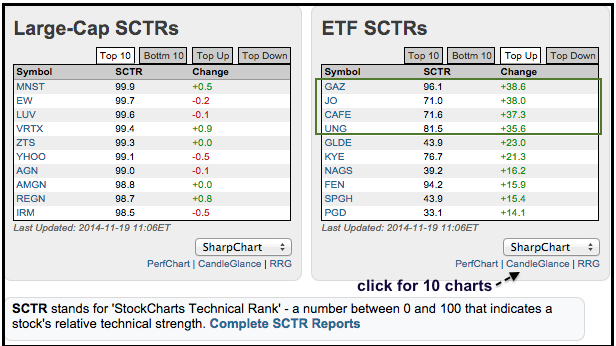
There is a little gem in the middle of the home page that shows the biggest moves for the StockCharts Technical Rank (SCTR). Clicking "Top Up" will show the biggest relative performance gainers, while clicking "Top Down" will show the biggest relative performance losers... Read More
Don't Ignore This Chart! November 18, 2014 at 01:06 PM
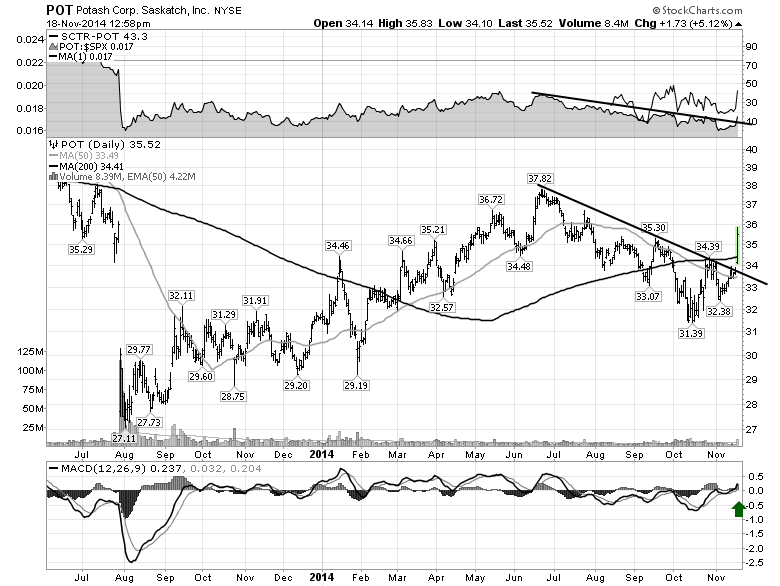
Potash Corp (POT) has made a huge bull candle today. We could understate it as just a trend line breakout. The whole Potash group jumped today so it does not appear to be company specific. This chart has such nice technicals. MACD moving positive today... Read More
Don't Ignore This Chart! November 17, 2014 at 04:23 PM
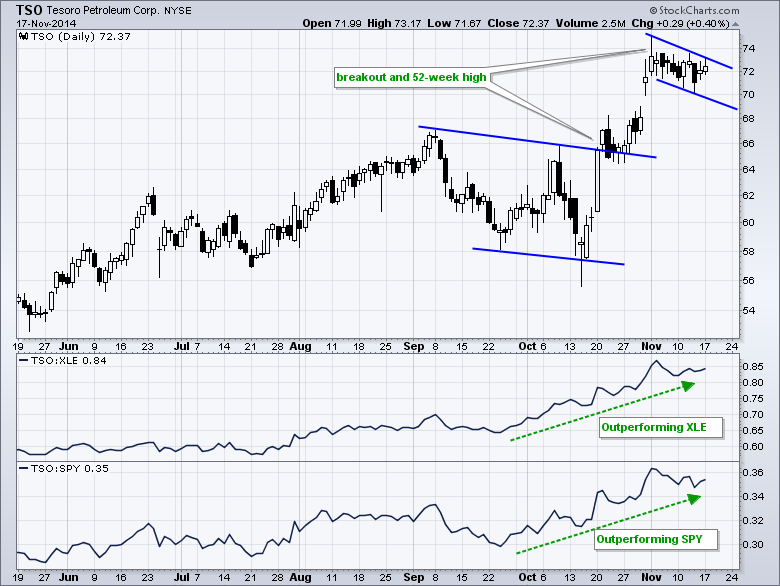
The Energy SPDR (XLE) is by far the weakest sector in the market right now. Most of its 43 components are in downtrends and well below the summer-autumn highs. One stock, however, stands out from this crowd... Read More
Don't Ignore This Chart! November 14, 2014 at 07:19 PM
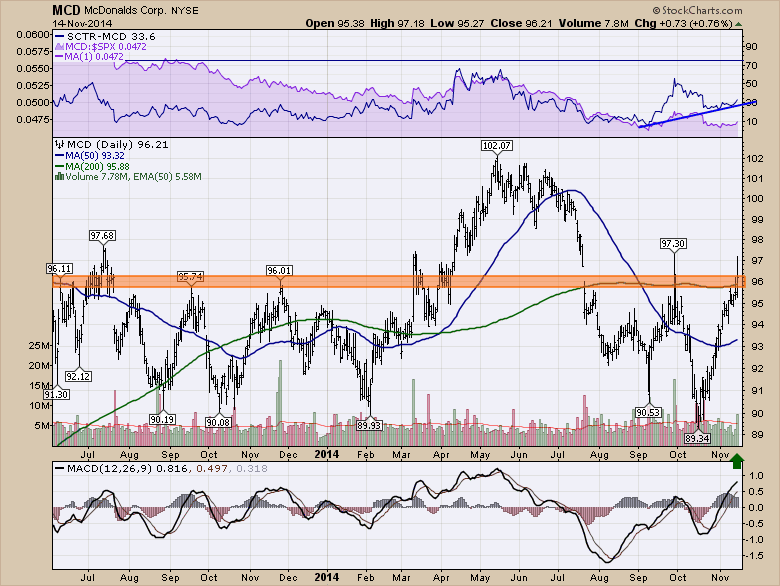
You know you are old when you can recite a 14 word tag line twenty years later. McDonald's (MCD) popped up on the radar today as the dining stocks have really ramped up lately... Read More
Don't Ignore This Chart! November 13, 2014 at 09:46 AM
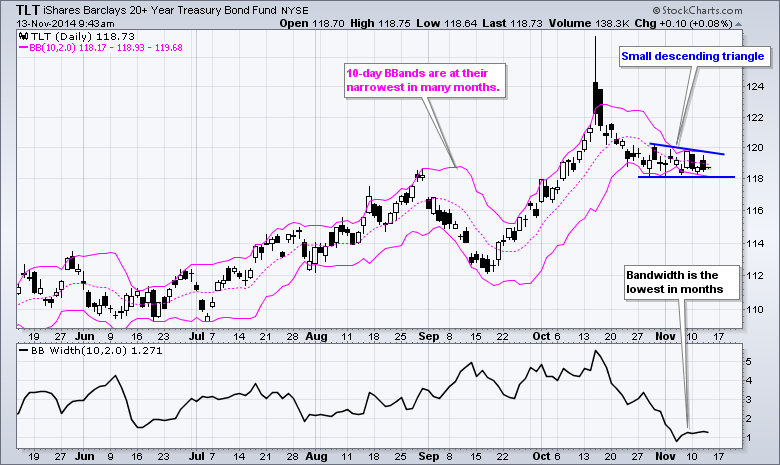
The 20+ YR T-Bond ETF (TLT) went ballistic in mid October with a surge above 125 and then sharply reversed with a close below 122 the next day. The ETF has since worked its way lower and volatility has seriously contracted... Read More
Don't Ignore This Chart! November 12, 2014 at 02:20 PM
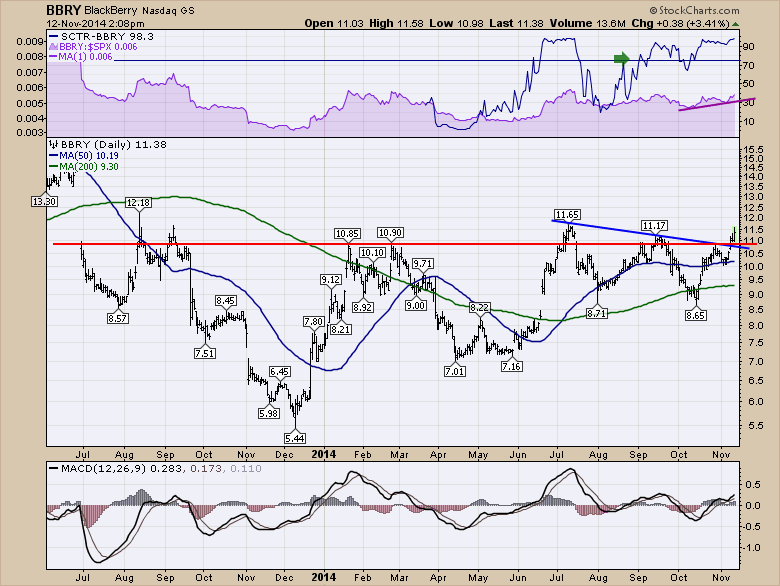
Who thought growing a Blackberry (BBRY) could be so challenging? The new CEO seems to be capable of generating interest by investors in their platform. Here is the chart... Read More
Don't Ignore This Chart! November 12, 2014 at 09:26 AM
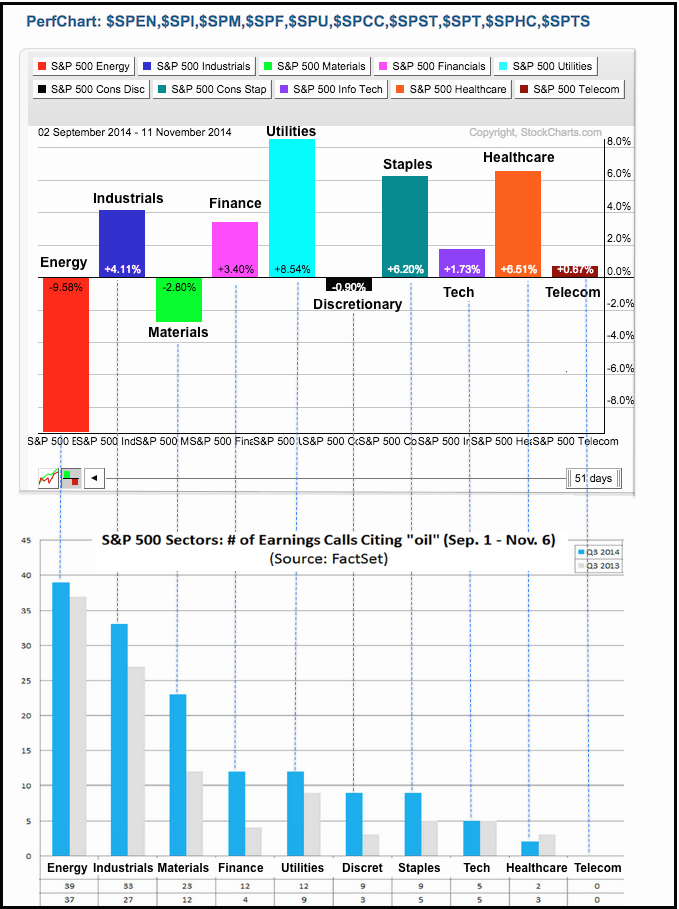
The top chart shows sector performance since the beginning of September. The bottom chart, from factset.com, shows the number of times companies in these sectors cited oil in their earnings calls (from 1-Sep to 6-Nov)... Read More
Don't Ignore This Chart! November 11, 2014 at 04:07 PM
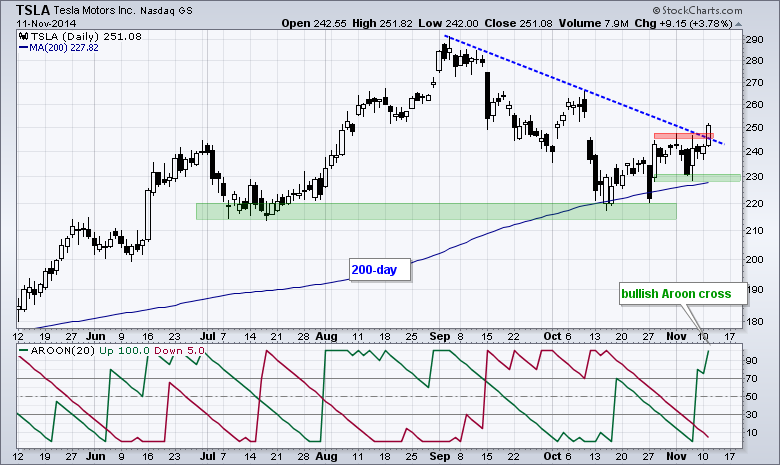
Tesla (TSLA) gapped down and fell sharply in early October, but ultimately held support from the July low and rising 200-day moving average. The stock moved higher the last four weeks and surged above the September trend line with a 3+ percent gain on Tuesday... Read More
Don't Ignore This Chart! November 10, 2014 at 02:41 PM
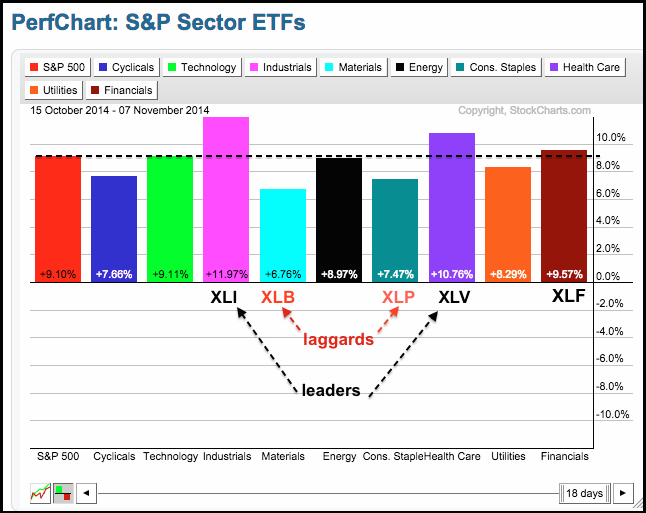
The stock market bottomed in mid October and then surged over the last 18 days. Chartists can find the leaders (and laggards) for this period by setting the PerfChart for 18 days. Simply double click the date tab and enter a number... Read More
Don't Ignore This Chart! November 07, 2014 at 12:09 PM
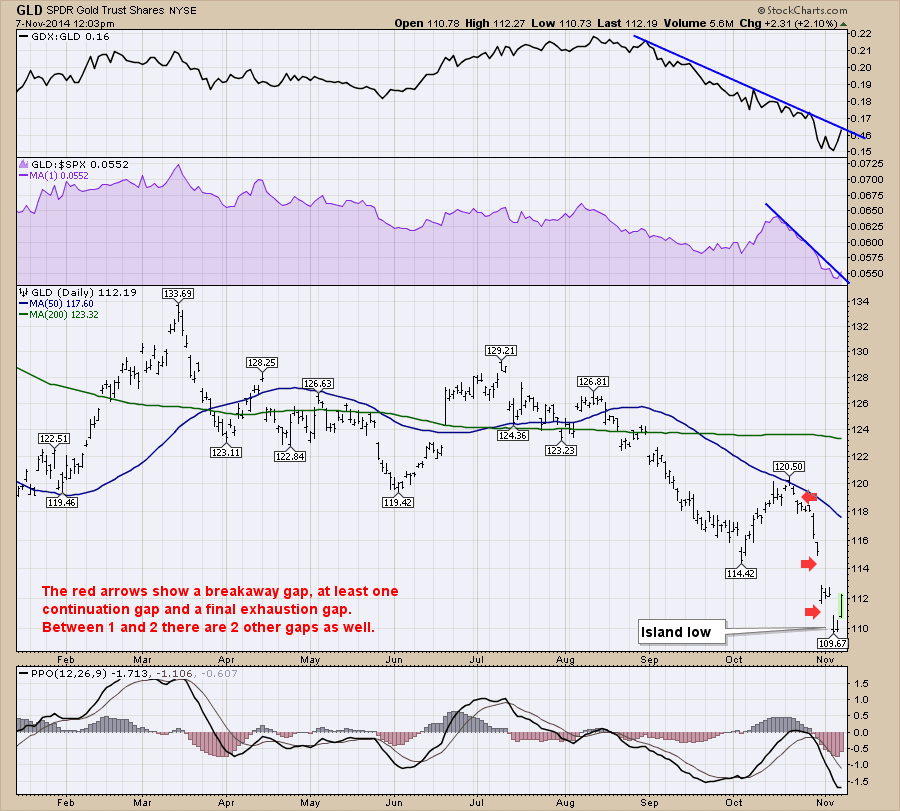
Gold ($GOLD) is painting a bullish candle today and surging back above the recent gap down. We have had $20 rallies before, but the exhaustion in this particular move seems complete... Read More
Don't Ignore This Chart! November 06, 2014 at 12:02 PM
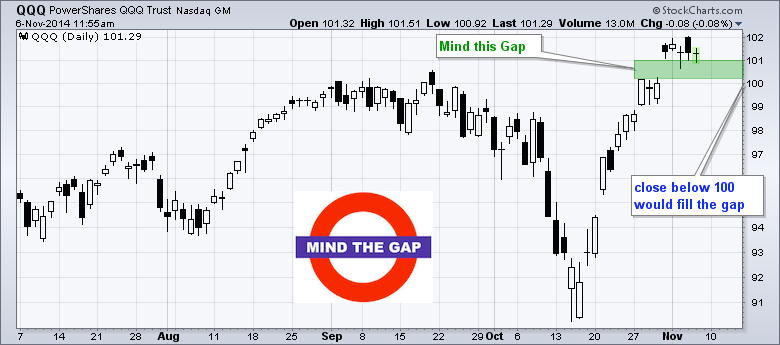
The London Tube is famous for its automated announcements reminding commuters to "mind the gap" between the train and the platform (don't fall in). QQQ has a gap that we should also mind. Notice how the ETF opened above 101 and closed above 101 the last four trading days... Read More
Don't Ignore This Chart! November 05, 2014 at 07:53 AM
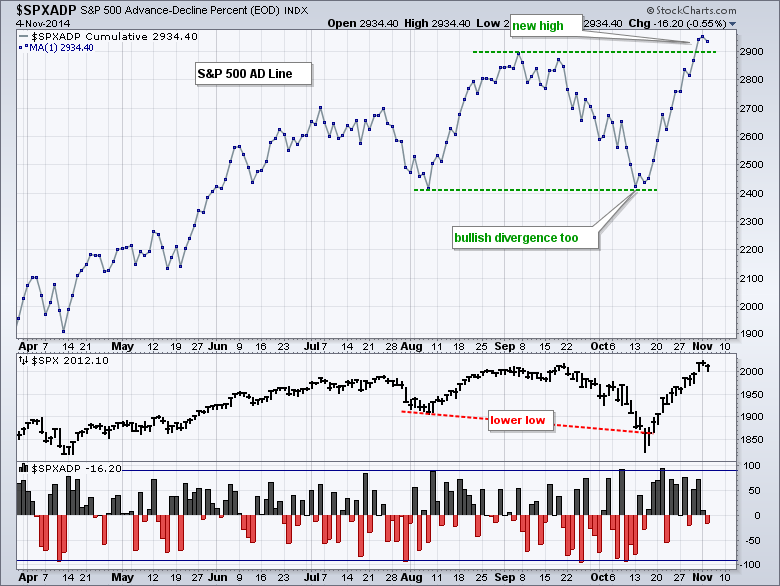
The S&P 500 AD Line ($SPXADP) confirmed the new high in the S&P 500 by hitting a new high of its own. The chart below shows the AD Line holding its early August low in mid October and surging above its early September high on Friday... Read More
Don't Ignore This Chart! November 04, 2014 at 09:23 AM
After the recent pullback, the overall market has blasted higher. Over the last week, I have noticed some of the strong momentum stocks under performing the $SPX... Read More
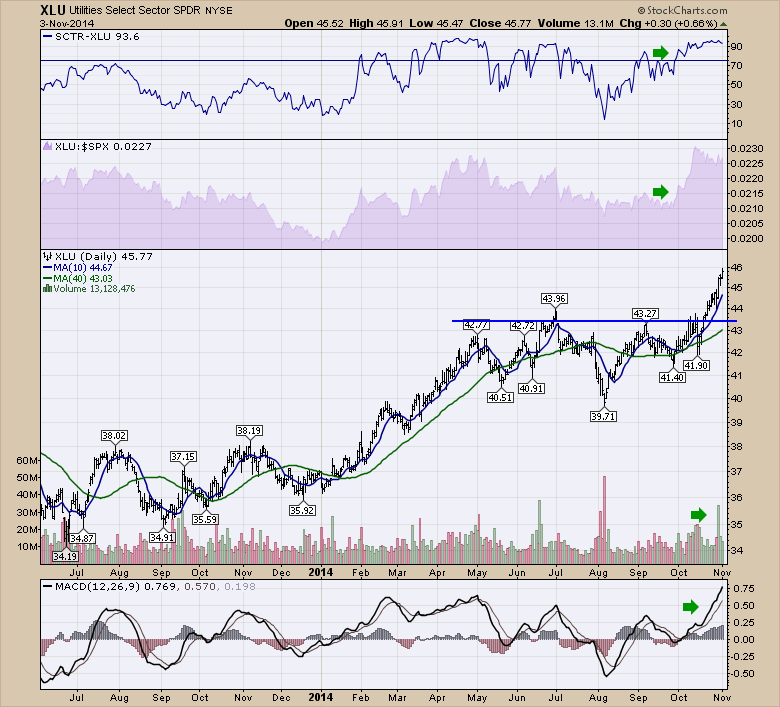
Don't Ignore This Chart! November 03, 2014 at 03:24 PM
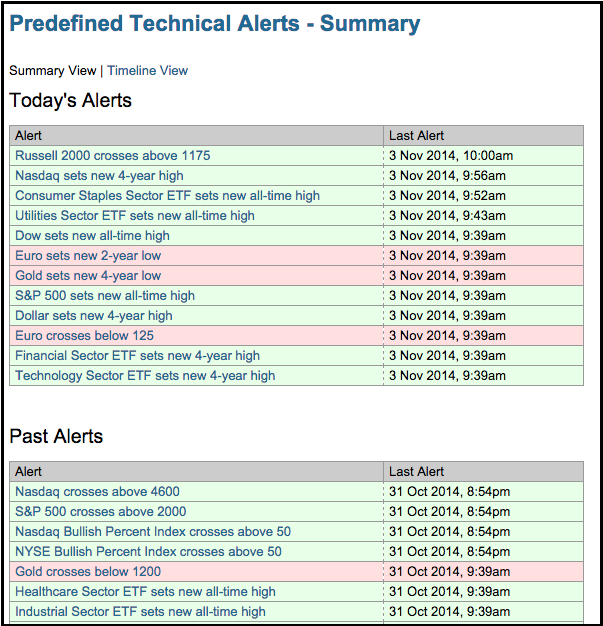
Chartists can get a good idea of market conditions just by looking at the predefined technical alerts page. Today's alerts are at the top and users can view past alerts by scrolling down the page... Read More