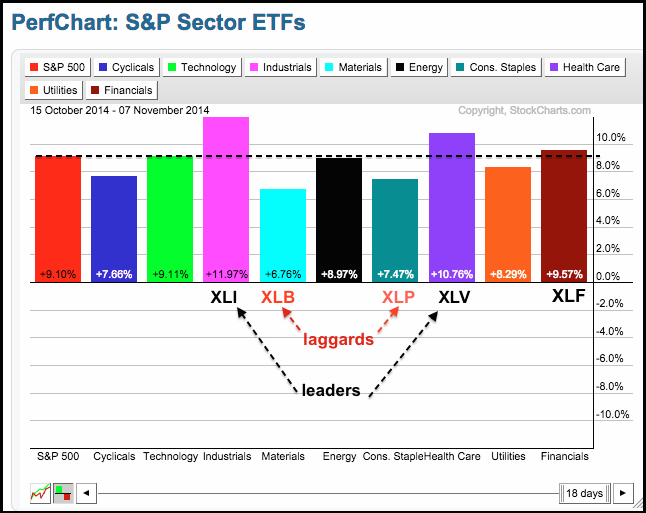
The stock market bottomed in mid October and then surged over the last 18 days. Chartists can find the leaders (and laggards) for this period by setting the PerfChart for 18 days. Simply double click the date tab and enter a number. The PerfChart below shows all nine sectors and SPY with big gains since October 15th. The Industrials SPDR (XLI) and HealthCare SPDR (XLV) are leading with double digit gains. The Materials SPDR (XLB) and Consumer Staples SPDR (XLP) are lagging with the smallest gains. The Finance SPDR (XLF) shows relative strength because it is up more than SPY.
Click this image for a live chart.

About the author:
Arthur Hill, CMT, is the Chief Technical Strategist at TrendInvestorPro.com. Focusing predominantly on US equities and ETFs, his systematic approach of identifying trend, finding signals within the trend, and setting key price levels has made him an esteemed market technician. Arthur has written articles for numerous financial publications including Barrons and Stocks & Commodities Magazine. In addition to his Chartered Market Technician (CMT) designation, he holds an MBA from the Cass Business School at City University in London.
Learn More