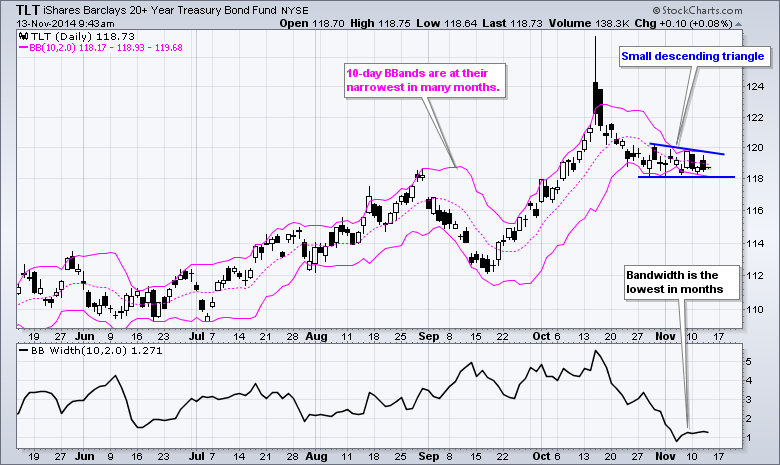
The 20+ YR T-Bond ETF (TLT) went ballistic in mid October with a surge above 125 and then sharply reversed with a close below 122 the next day. The ETF has since worked its way lower and volatility has seriously contracted. Notice that Bollinger BandWidth is at its lowest level in over six months. This means the distance between the two bands is the narrowest in over six months. The price pattern over the last three weeks looks like a small descending triangle, which is a bearish continuation pattern. A break below 118, therefore, would signal a continuation of the late October decline.
Click this image for a live chart.

About the author:
Arthur Hill, CMT, is the Chief Technical Strategist at TrendInvestorPro.com. Focusing predominantly on US equities and ETFs, his systematic approach of identifying trend, finding signals within the trend, and setting key price levels has made him an esteemed market technician. Arthur has written articles for numerous financial publications including Barrons and Stocks & Commodities Magazine. In addition to his Chartered Market Technician (CMT) designation, he holds an MBA from the Cass Business School at City University in London.
Learn More