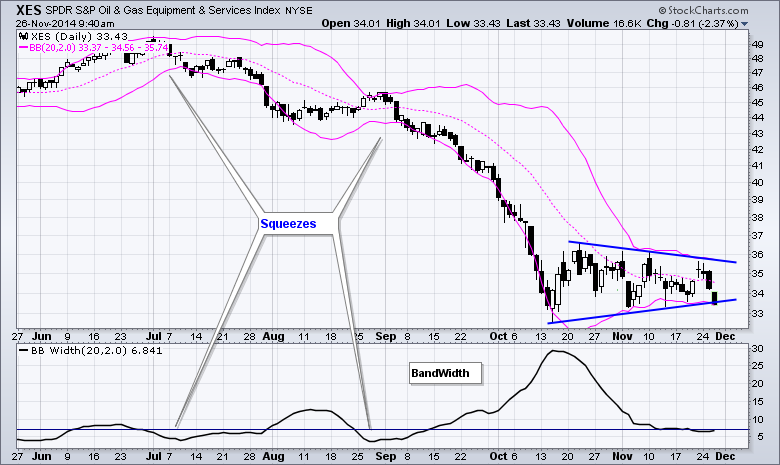
Oil remains weak overall and so do the energy related ETFs (XLE, XOP, XES). The chart below shows the Oil & Gas Equip & Services SPDR (XES) hitting a new low in October and then consolidating with a triangle. The pink lines show the Bollinger Bands narrowing like a noose around price action. The narrowing tells us that volatility is contracting and we can expect a volatility expansion to follow. Given the downtrend and the triangle, the odds favor a continuation lower.
Click this image for a live chart.

About the author:
Arthur Hill, CMT, is the Chief Technical Strategist at TrendInvestorPro.com. Focusing predominantly on US equities and ETFs, his systematic approach of identifying trend, finding signals within the trend, and setting key price levels has made him an esteemed market technician. Arthur has written articles for numerous financial publications including Barrons and Stocks & Commodities Magazine. In addition to his Chartered Market Technician (CMT) designation, he holds an MBA from the Cass Business School at City University in London.
Learn More