Google (GOOGL) is one of the great pioneering companies of our time. We use it every day and if someone tries to avoid using Google, it is almost impossible. So to see one of the dominant stocks in our world join the list of companies making fresh 52 week lows seems almost shocking. But Tuesday marked the first time Google made a 52 week low since the financial crisis. Yes, the last 52 week low was 6 years ago. With Wednesday's Patience Day, Google rallied but it rallied less than the $SPX, the Nasdaq Composite ($COMPQ), or the Nasdaq 100 ($NDX). It is a primary component of all of those. In a series of lower highs and lower lows since July, where could Google find support?
The volume on Tuesday and Wednesday was significantly higher than the 50 EMA on the volume. Google had the share class split (GOOG and GOOGL) around the middle of March which ultimately marked the 2014 top for the stock. The relative performance shown in purple at the top has been declining consistently since September. The SCTR shows the stock as one of the bottom 20% in terms of price performance. Looking back on the price action, Google would appear to be standing on a relative cliff with no price action (Gap) between the current price and $450. Google made a huge leap on earnings in October 2013 and moved up almost 10% from $450 to $500 and then migrated to $615 which was about a 25% gain from the price of $450. This gap seems like an ominous place for Google.
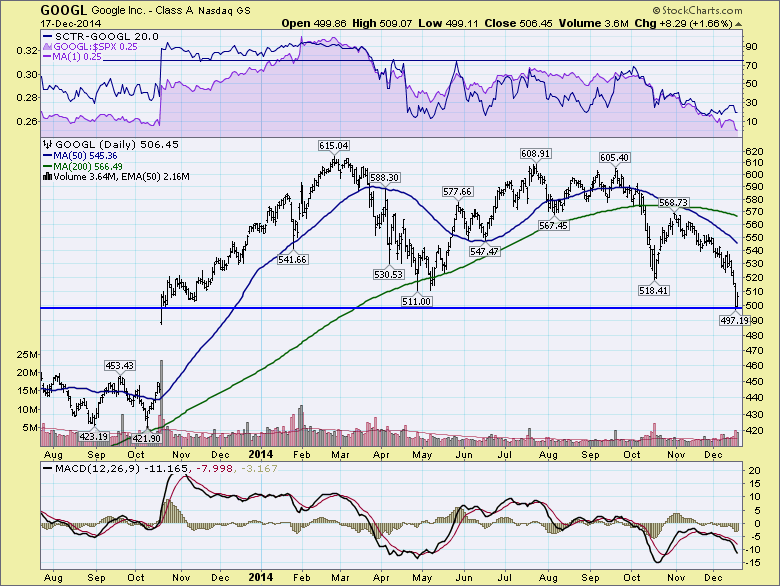
On the 6 year trend line off the 2008 lows, Google touched it Tuesday. For a long term trend line from the 2008 lows to the horizontal support from the gap, Google has garnered some attention and it showed up in the last two volume candles. The Pnf support line currently sits at 460 which is the bottom of the gap. With Google staring into the gap, I wasn't sure if the title should have been the Last Gap Saloon or the Last Gasp Saloon. There are compelling trend lines to buy it right here based on the horizontal support, a 6 year trend line and a one day move in and out of 52 week lows to take out any stops. But any failure to hold here would continue a significant price decline and make this broad topping pattern on the chart look long term. That would be remarkable for one of the greatest companies that supports our online work and personal life.
Good trading,
Greg Schnell, CMT
