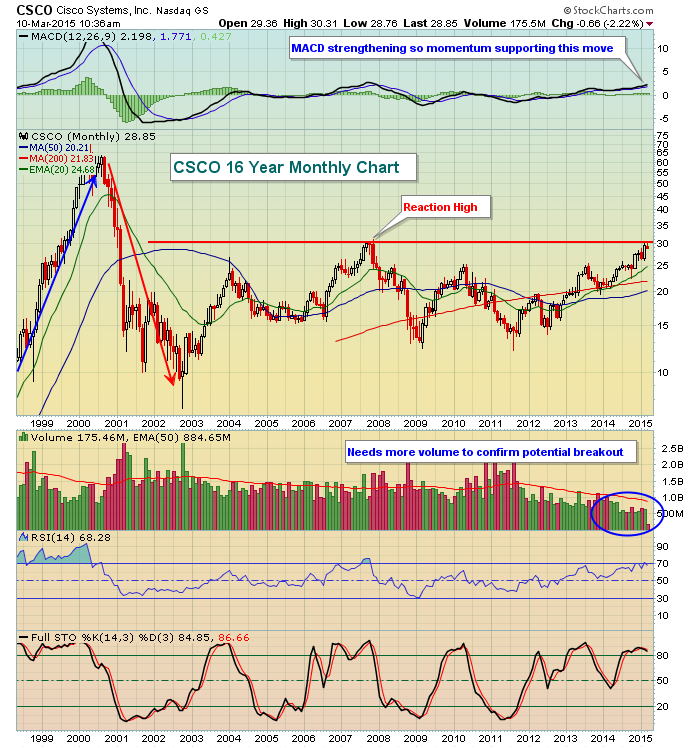
Since the tech bubble popped in the early 2000s, CSCO has slowly risen from the ashes. It fell a remarkable 90% from its high in 2000 to its low in late 2002. Keep in mind, however, that it made a parabolic move higher prior to this drop. 2000 started a bear market that most technology bulls would like to forget. Over the past 14 years, technology bulls have done just that. CSCO posted a reaction high slightly above 30.00 in October 2007, just before the latest infamous bear market. CSCO lost more than 50% of its value during that last bear market and now it's back again. That 30.00 resistance level is here and the bulls are excited - deservedly so. After all, a breakout above the 2007 high would suggest there's little technical resistance ahead as the fall to that level was quite steep back in the early 2000s. But as we look at the chart, weekly momentum is strong, but there seems to be very little interest in terms of volume to support this move. Therefore, it would make sense to be quite cautious until we see CSCO break through this price resistance and do so on expanding volume. Check out the long-term chart:
Happy trading!
Tom Bowley
