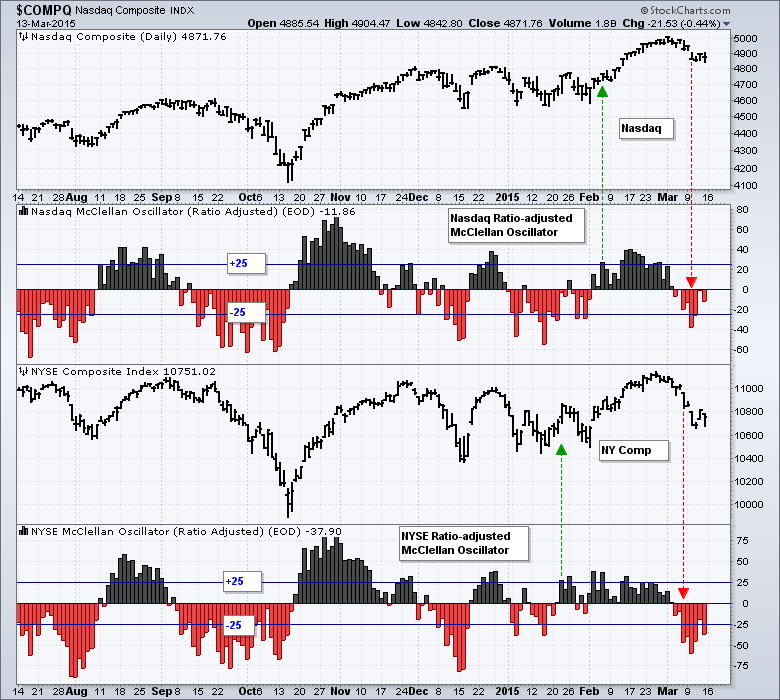
The NYSE McClellan Oscillator ($NYMO) turned negative on March 4th and moved below -25 on March 6th, while the Nasdaq McClellan Oscillator ($NAMO) also turned negative on March 4th, but did not move below -25 until March 10th (red arrows). As these charts show, chartists can use crosses of the zero line for signals or set a bullish-bearish threshold to reduce whipsaws. There were dozens of crosses above/below the zero lines over the last six months. By using +25 and -25 to qualify signals, chartists can reduce whipsaws significantly. Whipsaw reduction, however, does come at the expense of timing. In other words, these signals will come later and after prices have moved, a bit like trend following. Notice that these indicators are updated after the close (end-of-day (EOD)). Chartists can create McClellan Oscillators that update during the day using MACD and net advances. Click here for a video tutorial.
Click this image for a live chart
