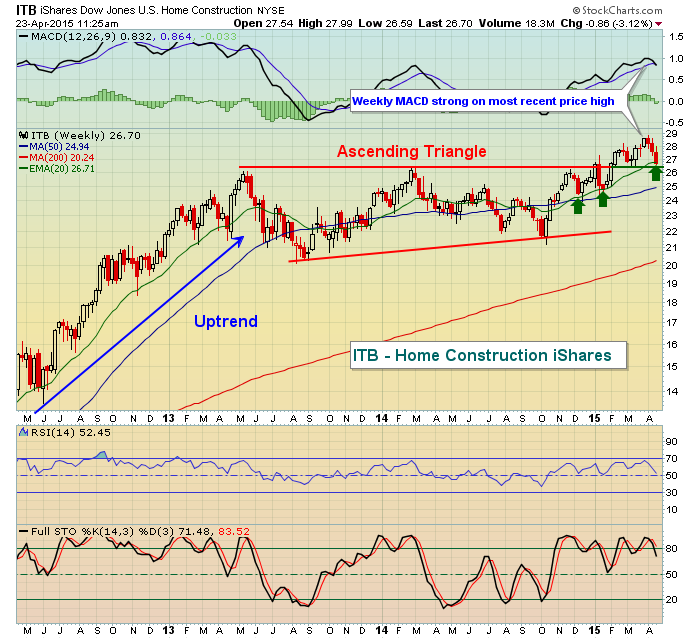
At 10am EST this morning, March new home sales were released and they fell well short of expectations. Is that a long-term problem for home construction ($DJUSHB) or is it an opportunity for traders to move into this area of the market at lower prices? Well, you'll have to be the judge. But technically, this has been, and continues to be in my opinion, one of the strongest areas of the stock market. The DJUSHB broke out of a bullish ascending triangle in February 2015 at the 550 level and has since been back to test price support there. Well, don't look now but we're testing that support once again. The rising 20 week EMA is currently at 552 and there's considerable strength on the weekly MACD as it set a new high recently that corresponded with a fresh price high. Generally, I find that rising 20 period EMA support holds when momentum is strong. So the big question today and tomorrow (since this is a weekly chart) is - where will this group close out the week? A tail below support and a close above would provide a solid reward to risk entry into the group. Rather than show the DJUSHB chart below, I'm showing the iShares equivalent (ITB), which is tradable for those who like to trade ETFs. Take a look:
Happy trading!
Tom
