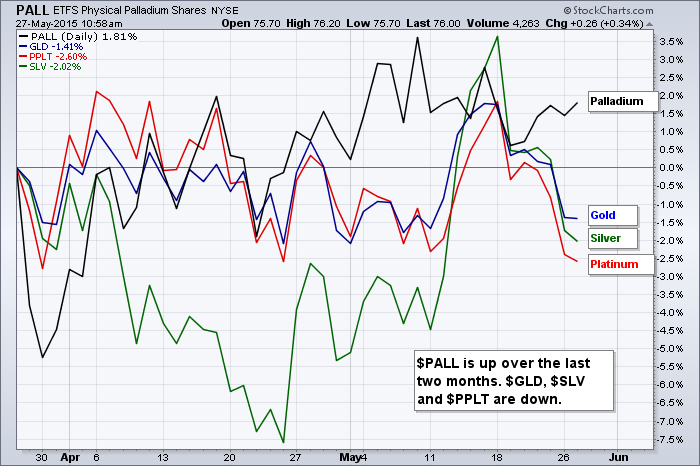
The Palladium ETF (PALL) caught my eye on Tuesday because it held up quite well when other metals were getting hit hard. Gold was down around 1.5%, while platinum and silver fell around 2%. PALL was down just .26% and the ETF is edging higher in early trading on Wednesday. The chart below shows two month performance for the Palladium ETF (PALL), Gold SPDR (GLD), Silver ETF (SLV) and Platinum ETF (PPLT). Notice that PALL is up and the other three are down.
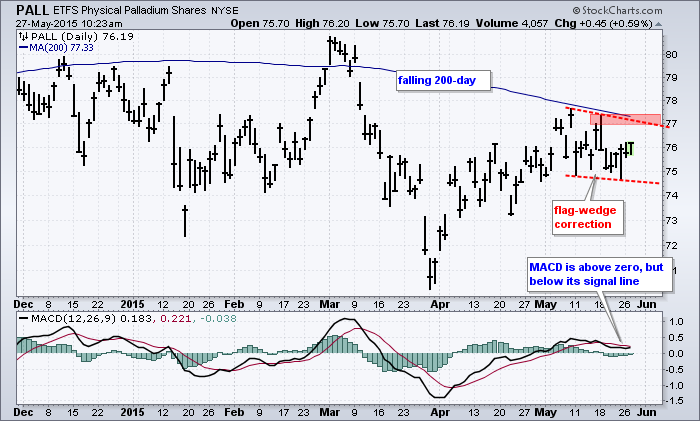
The chart after the jump shows a potentially bullish setup emerging.
The overall trend remains down because the ETF is below the falling 200-day moving average, but it would not take much to trigger a breakout. After a surge from 70 in late March to 77 in early May, the ETF consolidated into late May with a falling flag-wedge. This could be a mere correction after the prior advance. A move above 77.5 would break short-term resistance and signal a continuation of the April advance. Such a move would also break the 200-day SMA. The indicator window shows MACD in positive territory and just below the signal line. Look for a bullish signal line crossover to signal an upturn in momentum.
Click this image for a live chart
