Recently the Russell 2000 was outperforming the $SPX. Early in April, it stopped out-performing as you can see on the purple ratio. As the Russell Tracking ETF (IWM) hit new highs, it was underperforming the $SPX as the purple area drifted lower. Right now, the IWM has some great technical signals on it, making the next few weeks very important. Next, the SCTR shows IWM dropping from the 90 area to the 50 area. This loss of strength relative to the other ETF's makes this bounce very important to watch. If the IWM can break out to new highs here, we really want to see it pick up in relative performance on both the SCTR line and the $SPX ratio shown in purple. The third major technical signal we have is on the actual price. After breaking out to new highs in February, the IWM lost almost 12 weeks of price gains in one week late in April. Now, the bounce off the 120 is considered a test of support at the previous resistance line. It held up nicely with a big push higher today.
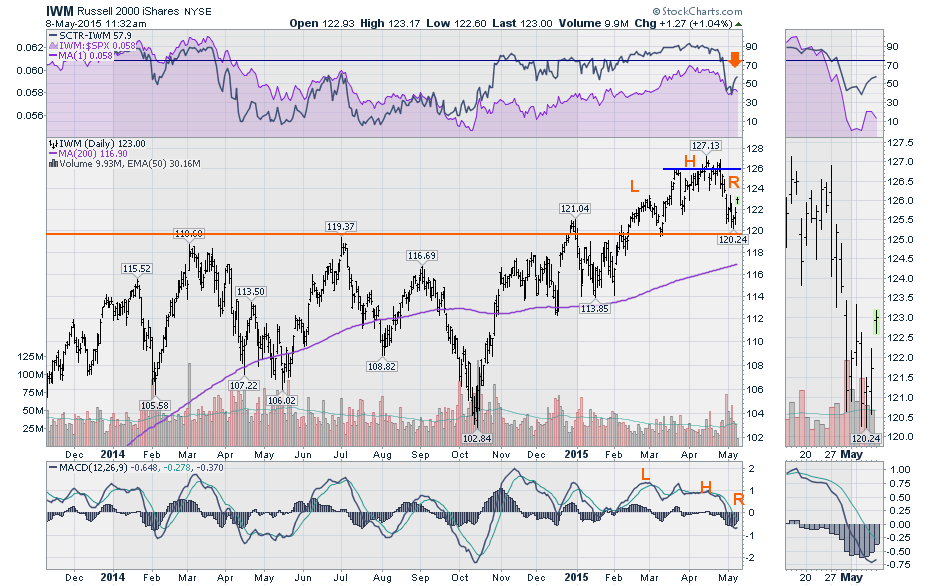
However, the technical structure of the pattern that has formed since February is building a typical head/shoulders structure and the MACD is making a traditional pattern for a Head and Shoulders price pattern. The momentum peaks are getting weaker and recently the MACD dipped below zero. This bounce is a very important place to look for a new thrust to change the sagging momentum and relative strength. If the Russell really starts to perform that bodes well based on the bounce off support at 120. If it struggles to make it up to the previous highs and stops at 126, this will be an important place for investors to add protection. If it makes a new high and rolls over the next day, the same consideration for protection should be in place. Let's watch this move!
Good trading,
Greg Schnell, CMT
