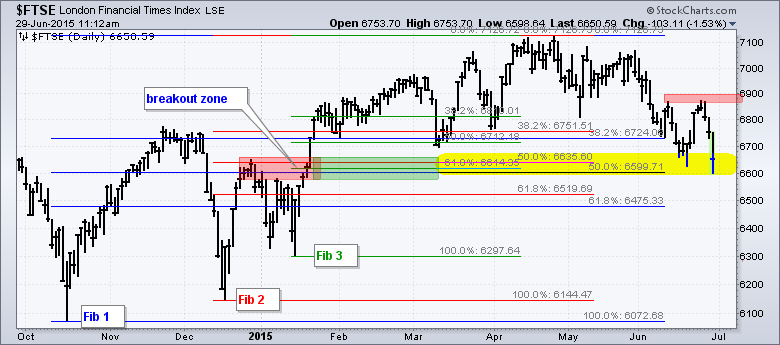
Today's post is for our UK traders because it focuses on the FTSE and three of the biggest banks in the UK. Shares in Europe were sharply lower in early trading on Monday with the German DAX Index ($DAX) and French CAC Index ($CAC) losing around 3%. The FTSE Index ($FTSE) in London was holding up relatively well with a 1.5% decline around midday. Chart 1 shows the FTSE peaking in the 7100 area in April and falling to the 6600 area in late June. Note that the index hit a 52-week high in April and this suggests that the long-term trend is up. In addition, the index is near a potential reversal zone marked by a Fibonacci cluster. Instead of picking just one advance to draw the Fibonacci Retracements Tool, I drew the Fibonacci retracements from the October (blue), December (red) and January lows (green). There was a cluster in the 6725 area, but this level did not hold and did not produce a reversal. The next cluster is in the 6600 area where the three lines overlap (yellow area). There is also potential support from broken resistance in this area. Despite potential support, the trend since late April is down and we need to reverse this downswing before betting on a continuation of the bigger uptrend. First resistance is set at 6900 and a break above this level would do the trick. I am also showing charts for three big banks after the jump.
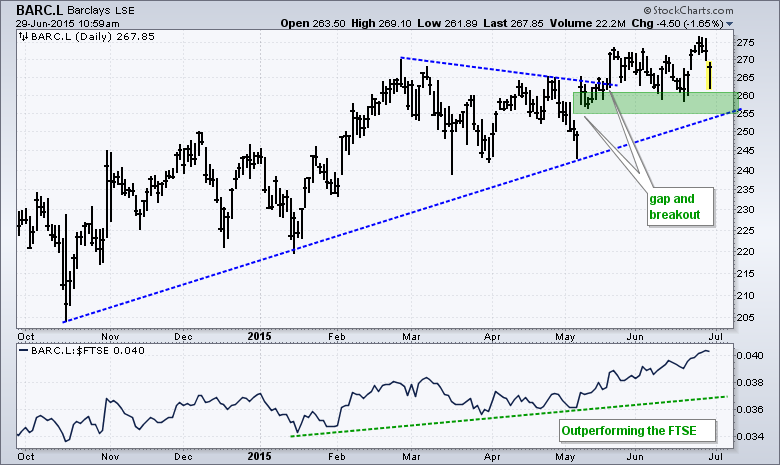
Barclays is in a clear uptrend with a new high last week. The breakout zone and October trend line mark support in the 255-260 area. Barclays is also showing relative strength and outperforming the FTSE Index.
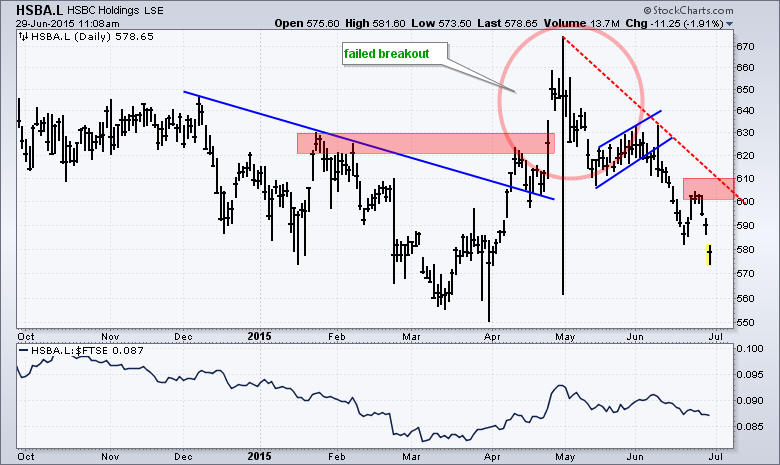
HSBC Holdings failed to hold its surge and break out in April. The stock then formed a rising flag into early June and broke down a few weeks ago. The May trend line and late June high mark resistance in the 600-610 area.
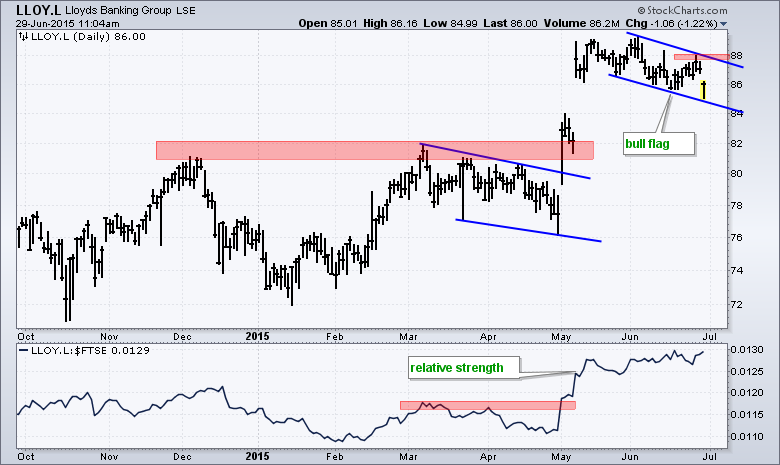
Lloyds Banking Group broke out with a big surge in early May and then formed a falling flag in June. This is a bullish continuation pattern and a break above 88 would signal a continuation higher.