Rite-Aid (RAD) has a very interesting chart formation this week. Recently the stock surged to long term highs. As it continues to battle against the resistance levels, we can see $8.75 seems to be an important area for the stock. It struggled to push above $8.75 in early April. After spending a week trying to go higher, it rolled over after making new highs. In May, it tried again. In June it has pushed up within a penny of the April highs. after a quick dip down on Friday, Rite-Aid was bought again on Monday and Tuesday. If we look at the top of the chart, the SCTR broke above 75 in December and the stock rallied 20% within 6 weeks. After making higher lows going sideways from February to June, it looks like Rite-Aid is ready to move up through resistance now.
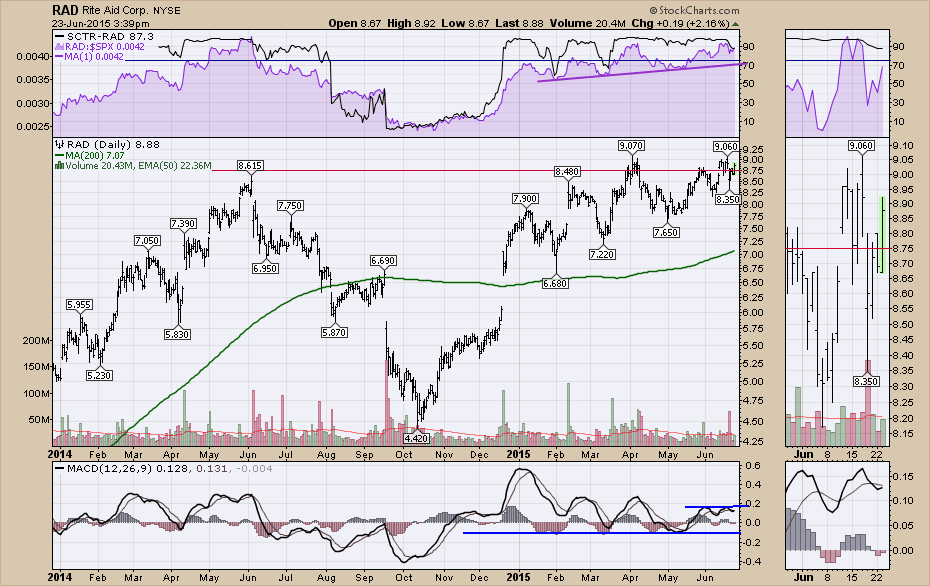
If there was anything to worry about on the chart it was the high volume on Thursday on a big down candle and that was also a bullish general market day. It is a warning sign that stops just below are important. However, everything including the SCTR showing the stock performing better than 87% of the peer group. Thats pretty important!
Good trading,
Greg Schnell, CMT
