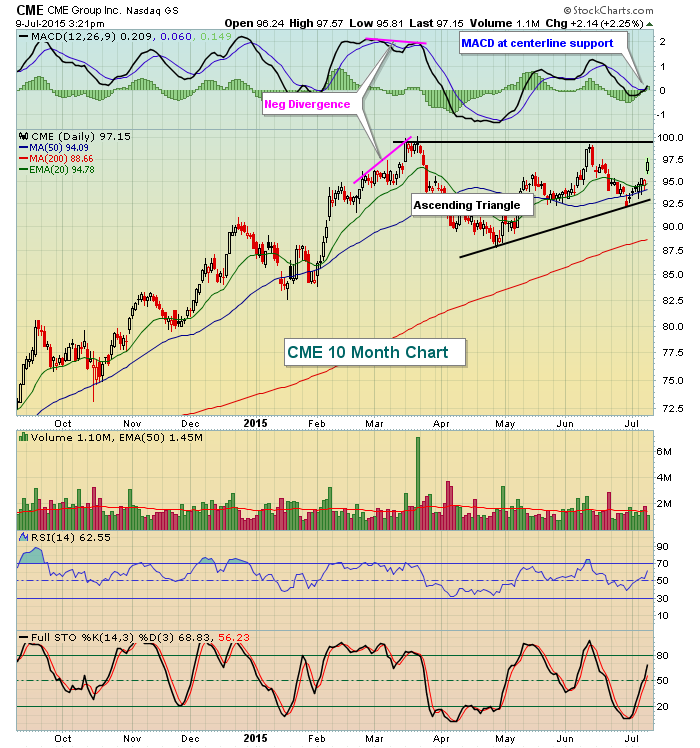
The recent movement in CME shares back and forth is nothing but noise. The technical picture here is very solid with an uptrend in place that began in early 2013, preceding the current ascending triangle formation. During that span, CME more than doubled its stock price although its March high was still approximately 10% below its all-time high set back in late 2007. While we're likely to see continuing consolidation in the near-term on CME, a high volume breakout of this triangle pattern would measure to the 110-112 range, which would challenge its all-time high. CME ran into momentum issues back in March as a negative divergence printed on its MACD just as 2015 highs were reached. CME was also overbought at the time so the consolidation since March has helped the stock on a number of levels. Check out the chart:
Happy trading!
Tom
